
Unusual options activity report: September 2026
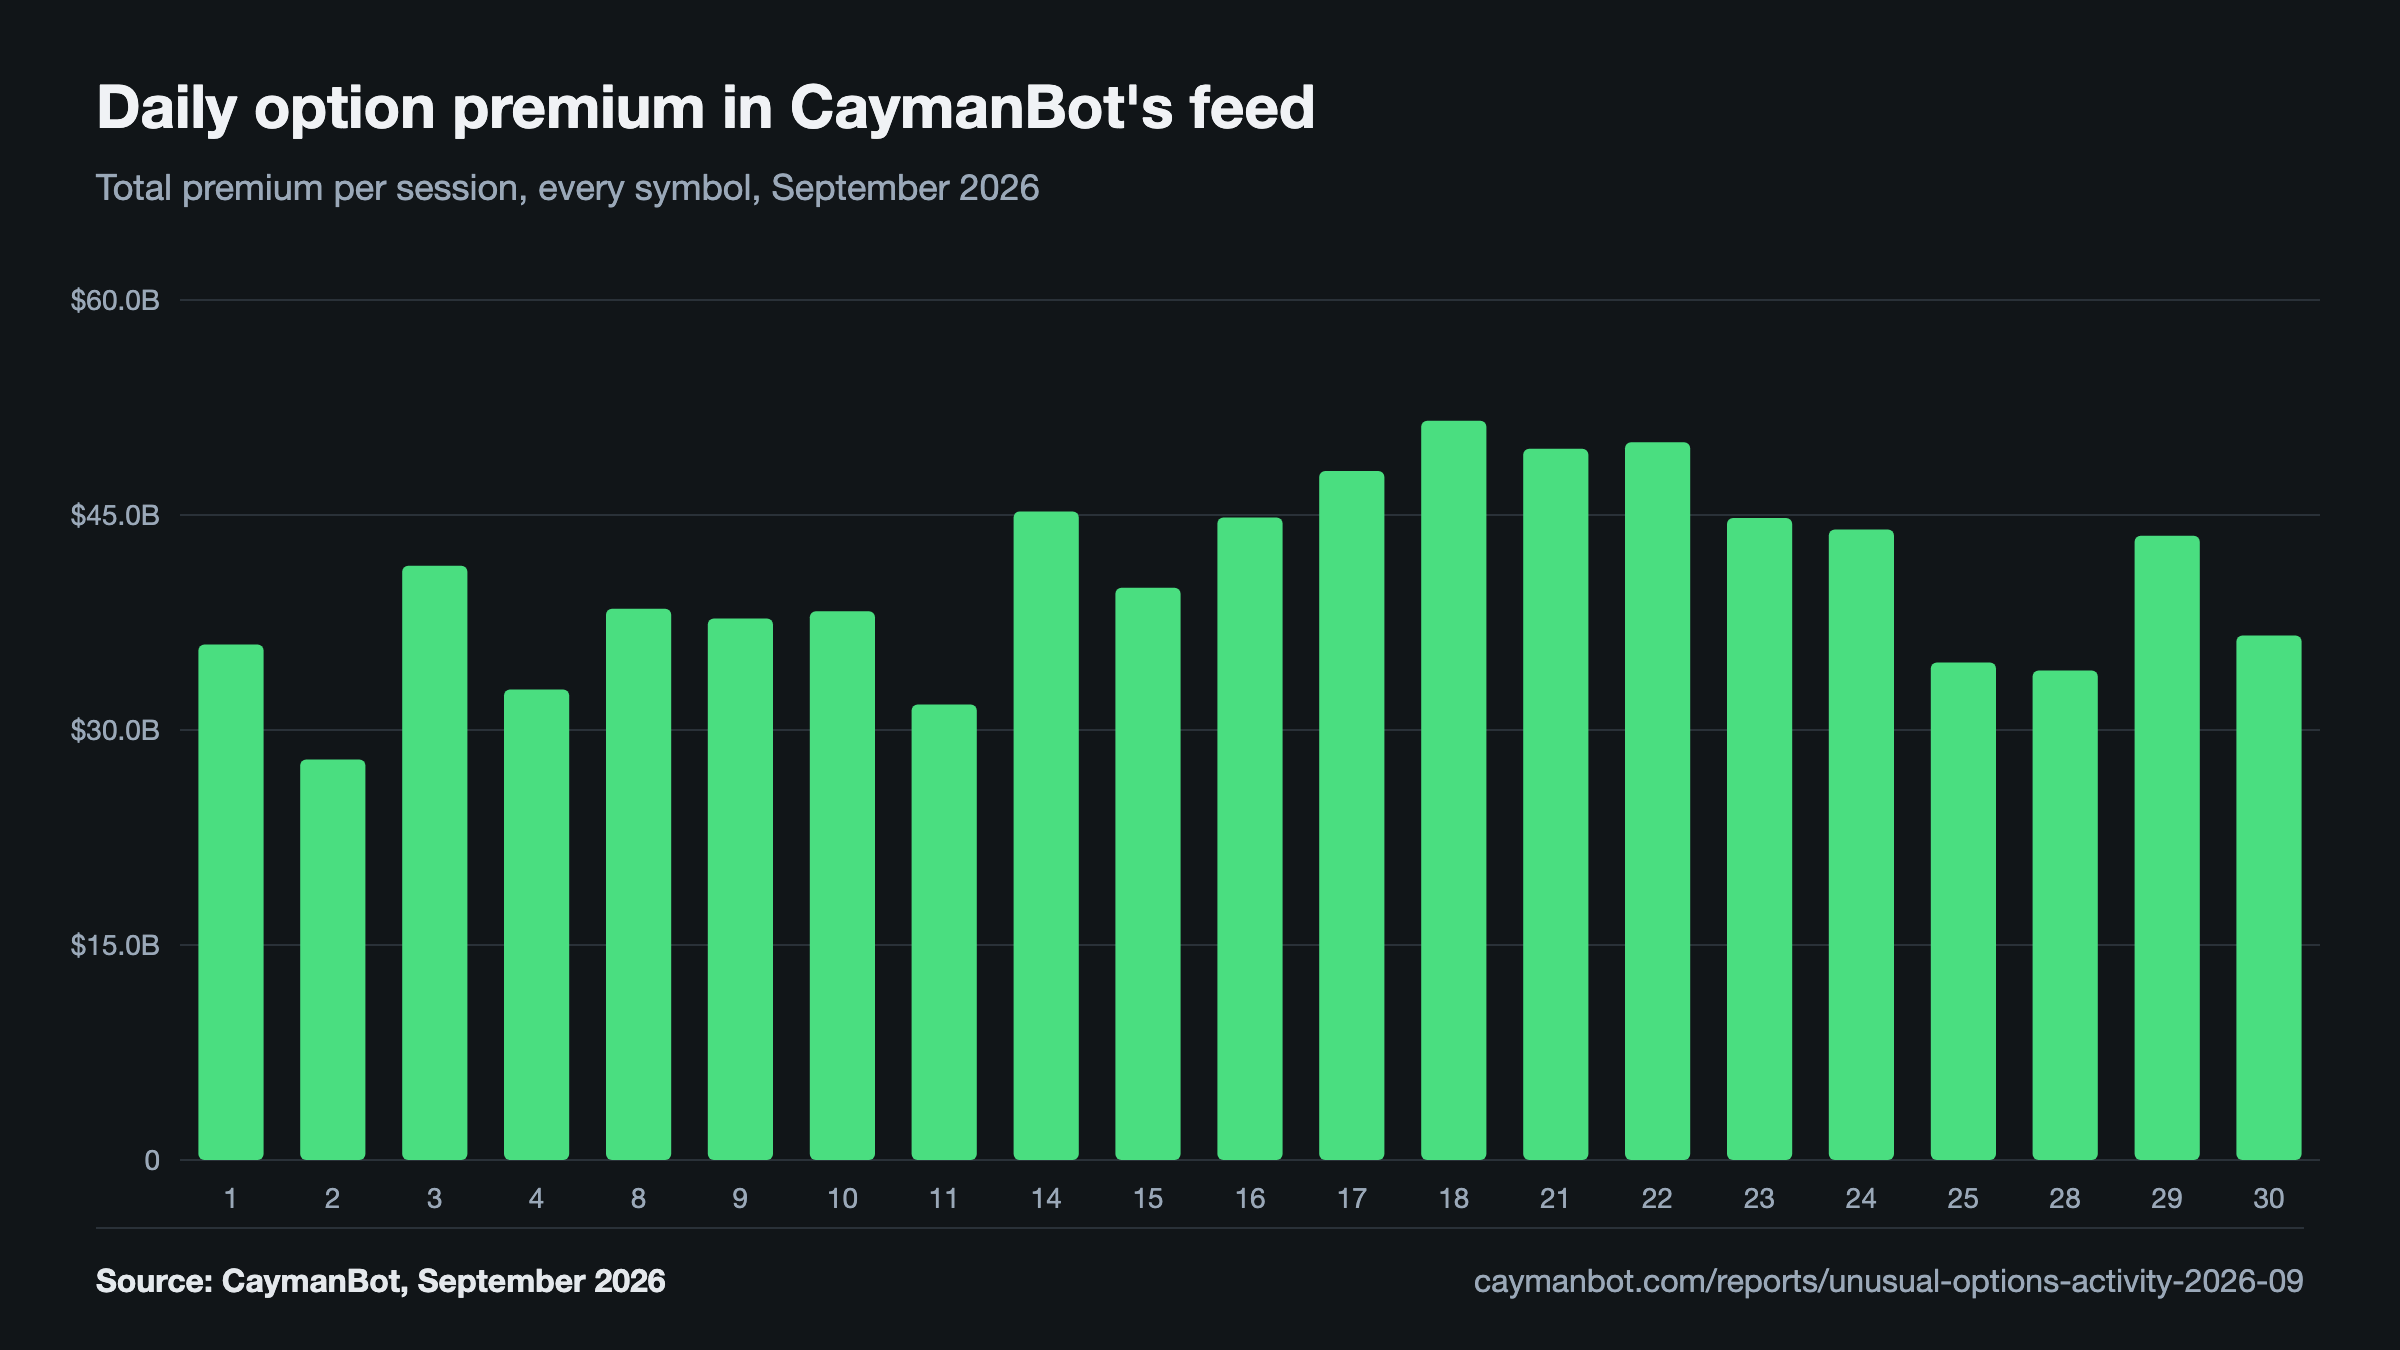
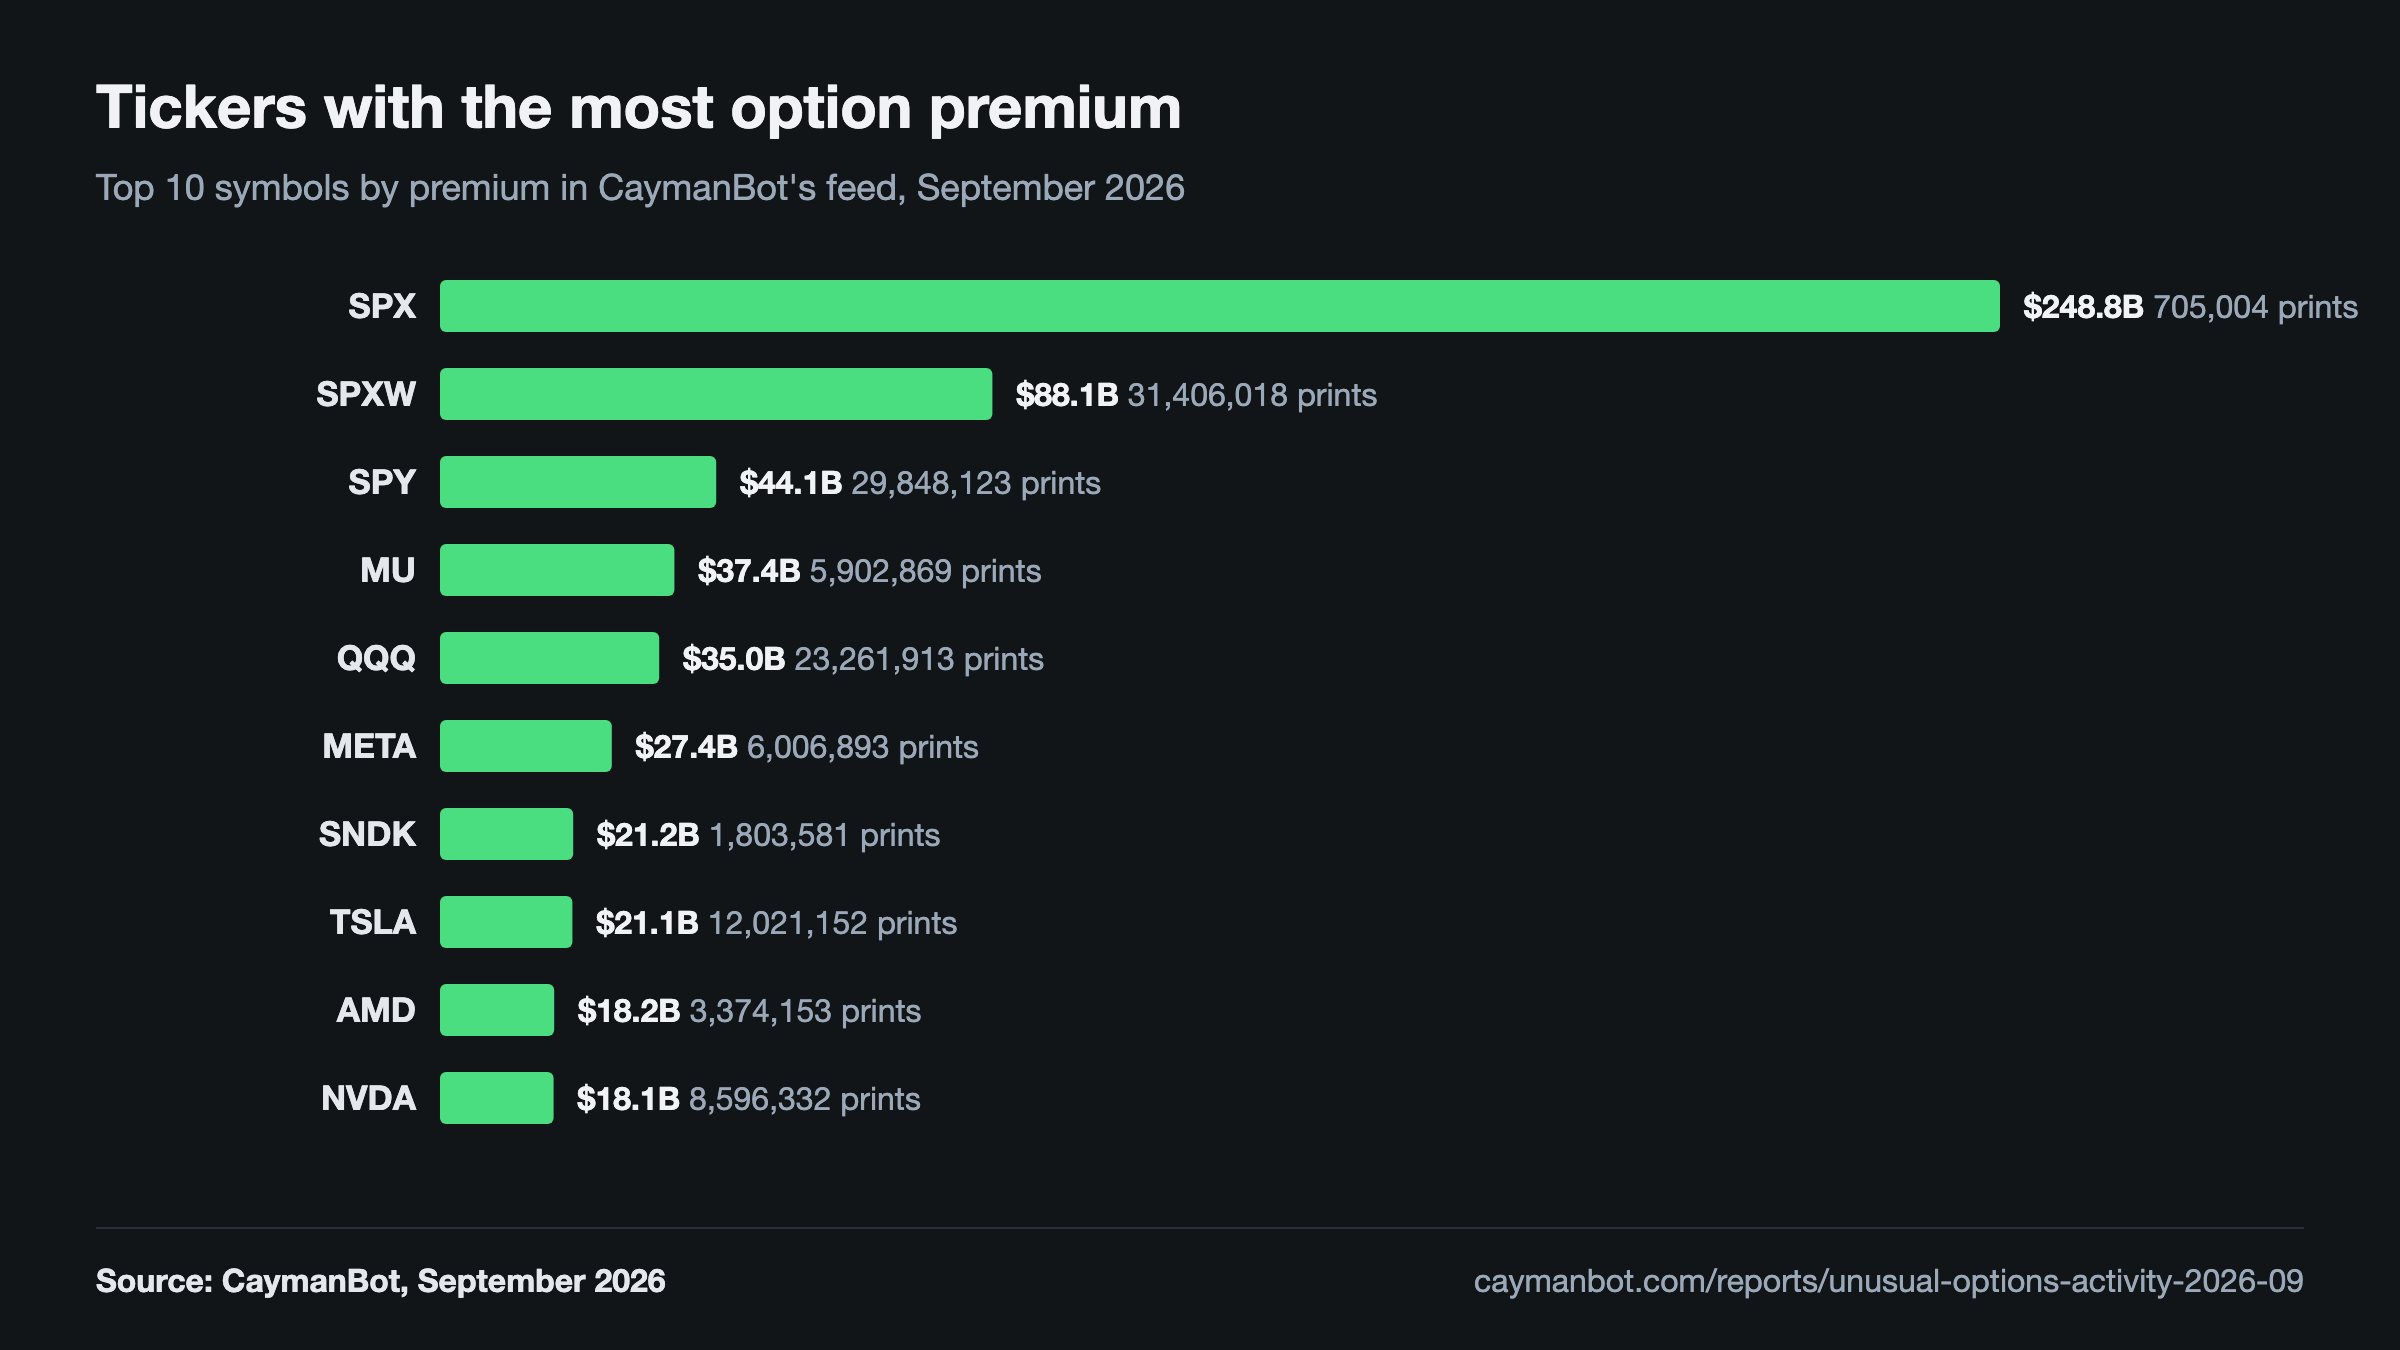
What the option trades in CaymanBot's feed showed in September 2026, in five charts: premium by session, the tickers with the most premium, how many symbols the unusual-activity score flagged on each session, the flagged sessions with the most premium, and the 10 largest prints by premium.
OPRA options data delayed at least 48 hours (2 days).
- Premium in the feed
- $851.6B
- Prints
- 232,575,203
- Sessions
- 21
- Flagged symbol-sessions
- 220
Unusual-activity flags by session
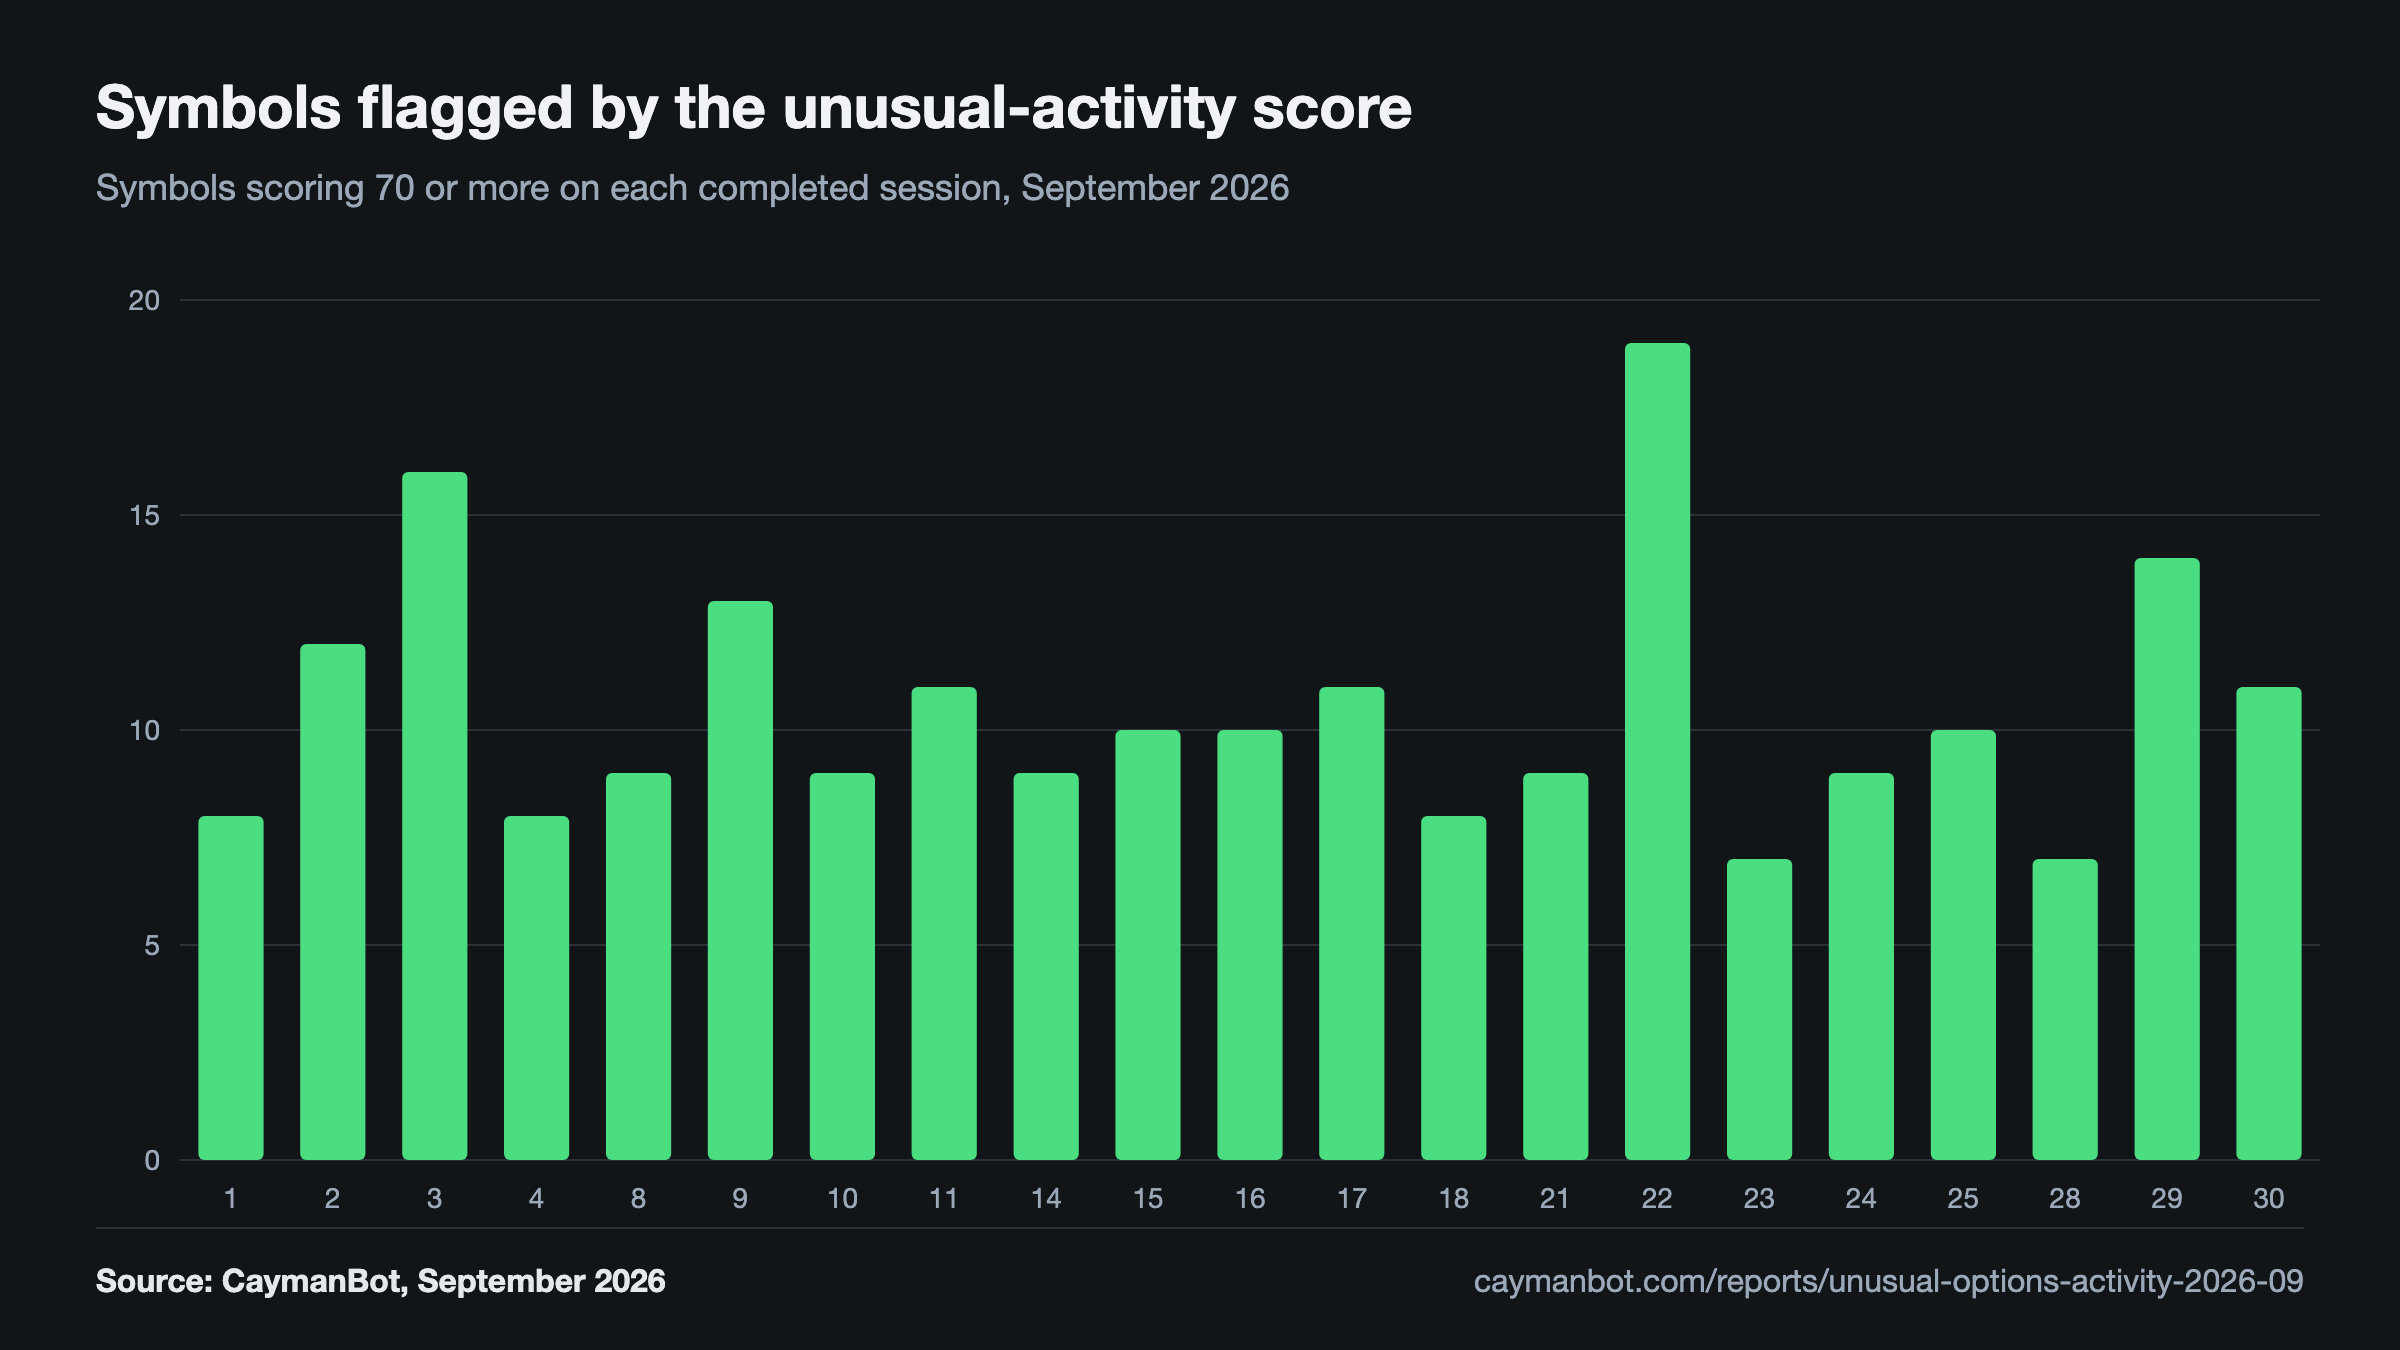
Scored on each completed session, 220 symbol-sessions reached a score of 70 or more, across 200 symbols, out of 93,812 scored. No symbol was flagged on more than 3 sessions. The session with the most flags was Sep 22, with 19.
Show the data
| Session | Flagged symbols | Symbols scored |
|---|---|---|
| Sep 1, 2026 | 8 | 4,447 |
| Sep 2, 2026 | 12 | 4,436 |
| Sep 3, 2026 | 16 | 4,447 |
| Sep 4, 2026 | 8 | 4,370 |
| Sep 8, 2026 | 9 | 4,478 |
| Sep 9, 2026 | 13 | 4,408 |
| Sep 10, 2026 | 9 | 4,458 |
| Sep 11, 2026 | 11 | 4,376 |
| Sep 14, 2026 | 9 | 4,525 |
| Sep 15, 2026 | 10 | 4,422 |
| Sep 16, 2026 | 10 | 4,480 |
| Sep 17, 2026 | 11 | 4,485 |
| Sep 18, 2026 | 8 | 4,715 |
| Sep 21, 2026 | 9 | 4,715 |
| Sep 22, 2026 | 19 | 4,621 |
| Sep 23, 2026 | 7 | 4,454 |
| Sep 24, 2026 | 9 | 4,401 |
| Sep 25, 2026 | 10 | 4,397 |
| Sep 28, 2026 | 7 | 4,429 |
| Sep 29, 2026 | 14 | 4,382 |
| Sep 30, 2026 | 11 | 4,366 |
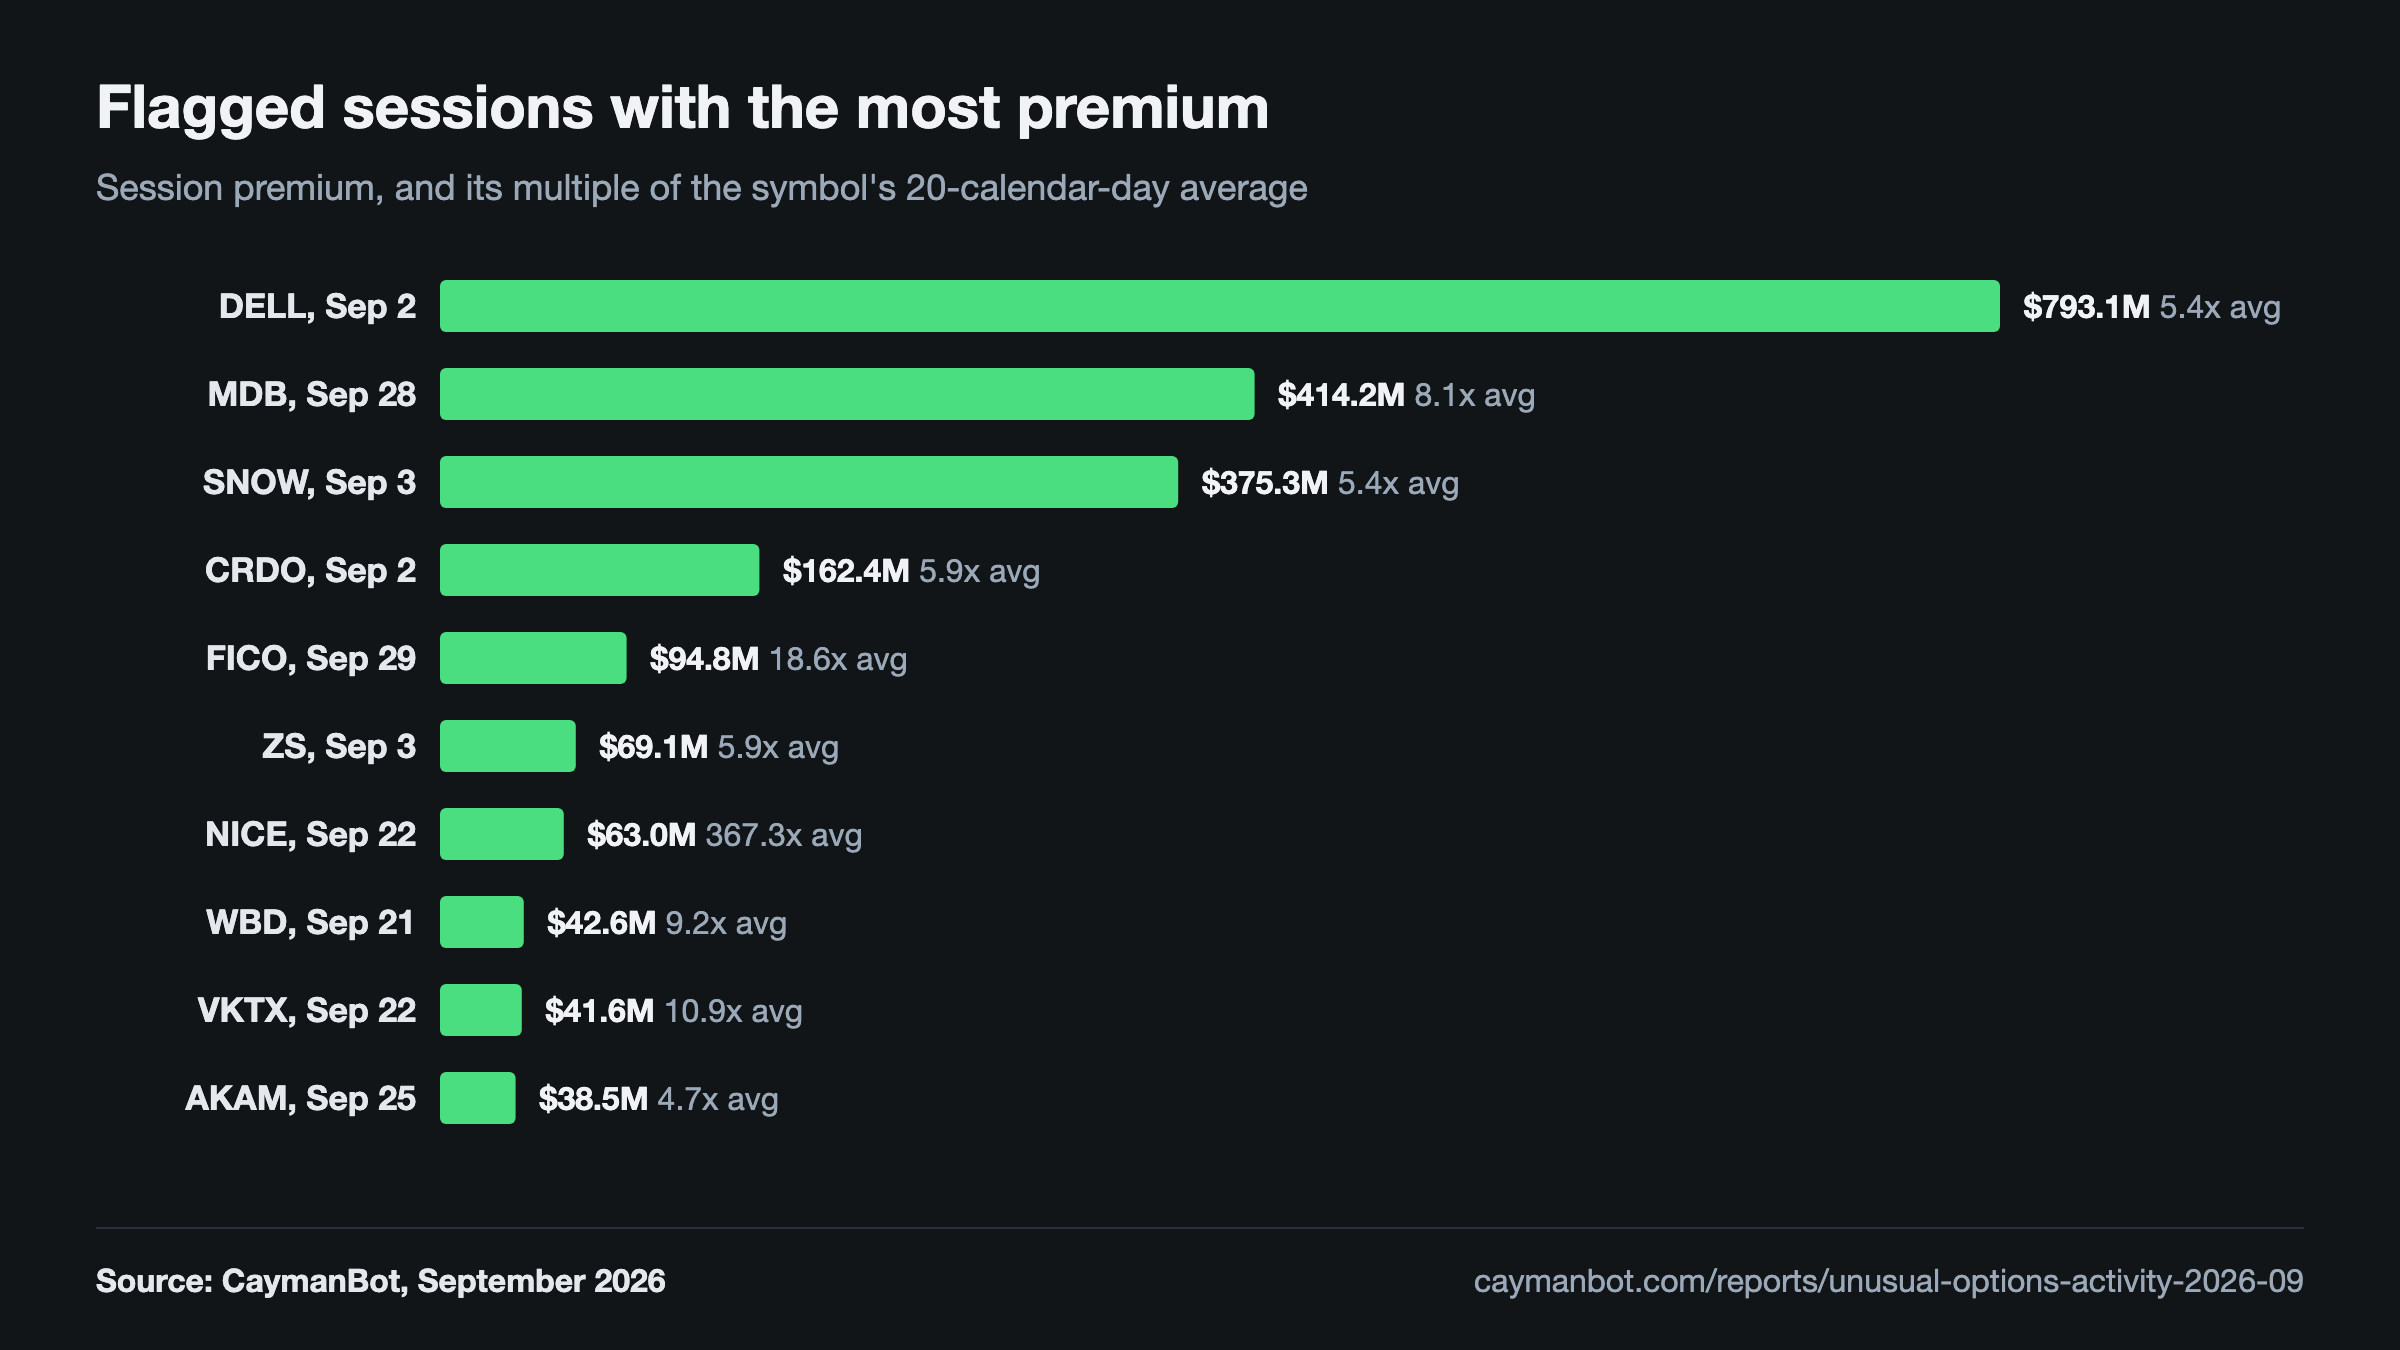
Flagged sessions with the most premium
DELL on Sep 2 carried $793.1M in premium, 5.4x its 20-calendar-day average, and scored 70.00. The highest multiple among these 10 was NICE on Sep 22, at 367.3x its average.
Show the data
| Symbol | Session | Score | Premium | 20-calendar-day average | Multiple |
|---|---|---|---|---|---|
| DELL | Sep 2, 2026 | 70.00 | $793,143,462 | $147,991,184 | 5.4x |
| MDB | Sep 28, 2026 | 80.00 | $414,155,652 | $51,016,751 | 8.1x |
| SNOW | Sep 3, 2026 | 72.46 | $375,269,874 | $69,732,516 | 5.4x |
| CRDO | Sep 2, 2026 | 74.12 | $162,381,003 | $27,352,442 | 5.9x |
| FICO | Sep 29, 2026 | 79.91 | $94,841,610 | $5,108,945 | 18.6x |
| ZS | Sep 3, 2026 | 73.12 | $69,063,387 | $11,748,664 | 5.9x |
| NICE | Sep 22, 2026 | 70.43 | $62,965,790 | $171,415 | 367.3x |
| WBD | Sep 21, 2026 | 78.52 | $42,588,890 | $4,649,056 | 9.2x |
| VKTX | Sep 22, 2026 | 73.27 | $41,570,886 | $3,822,055 | 10.9x |
| AKAM | Sep 25, 2026 | 70.78 | $38,452,801 | $8,115,500 | 4.7x |
The 10 largest prints by premium
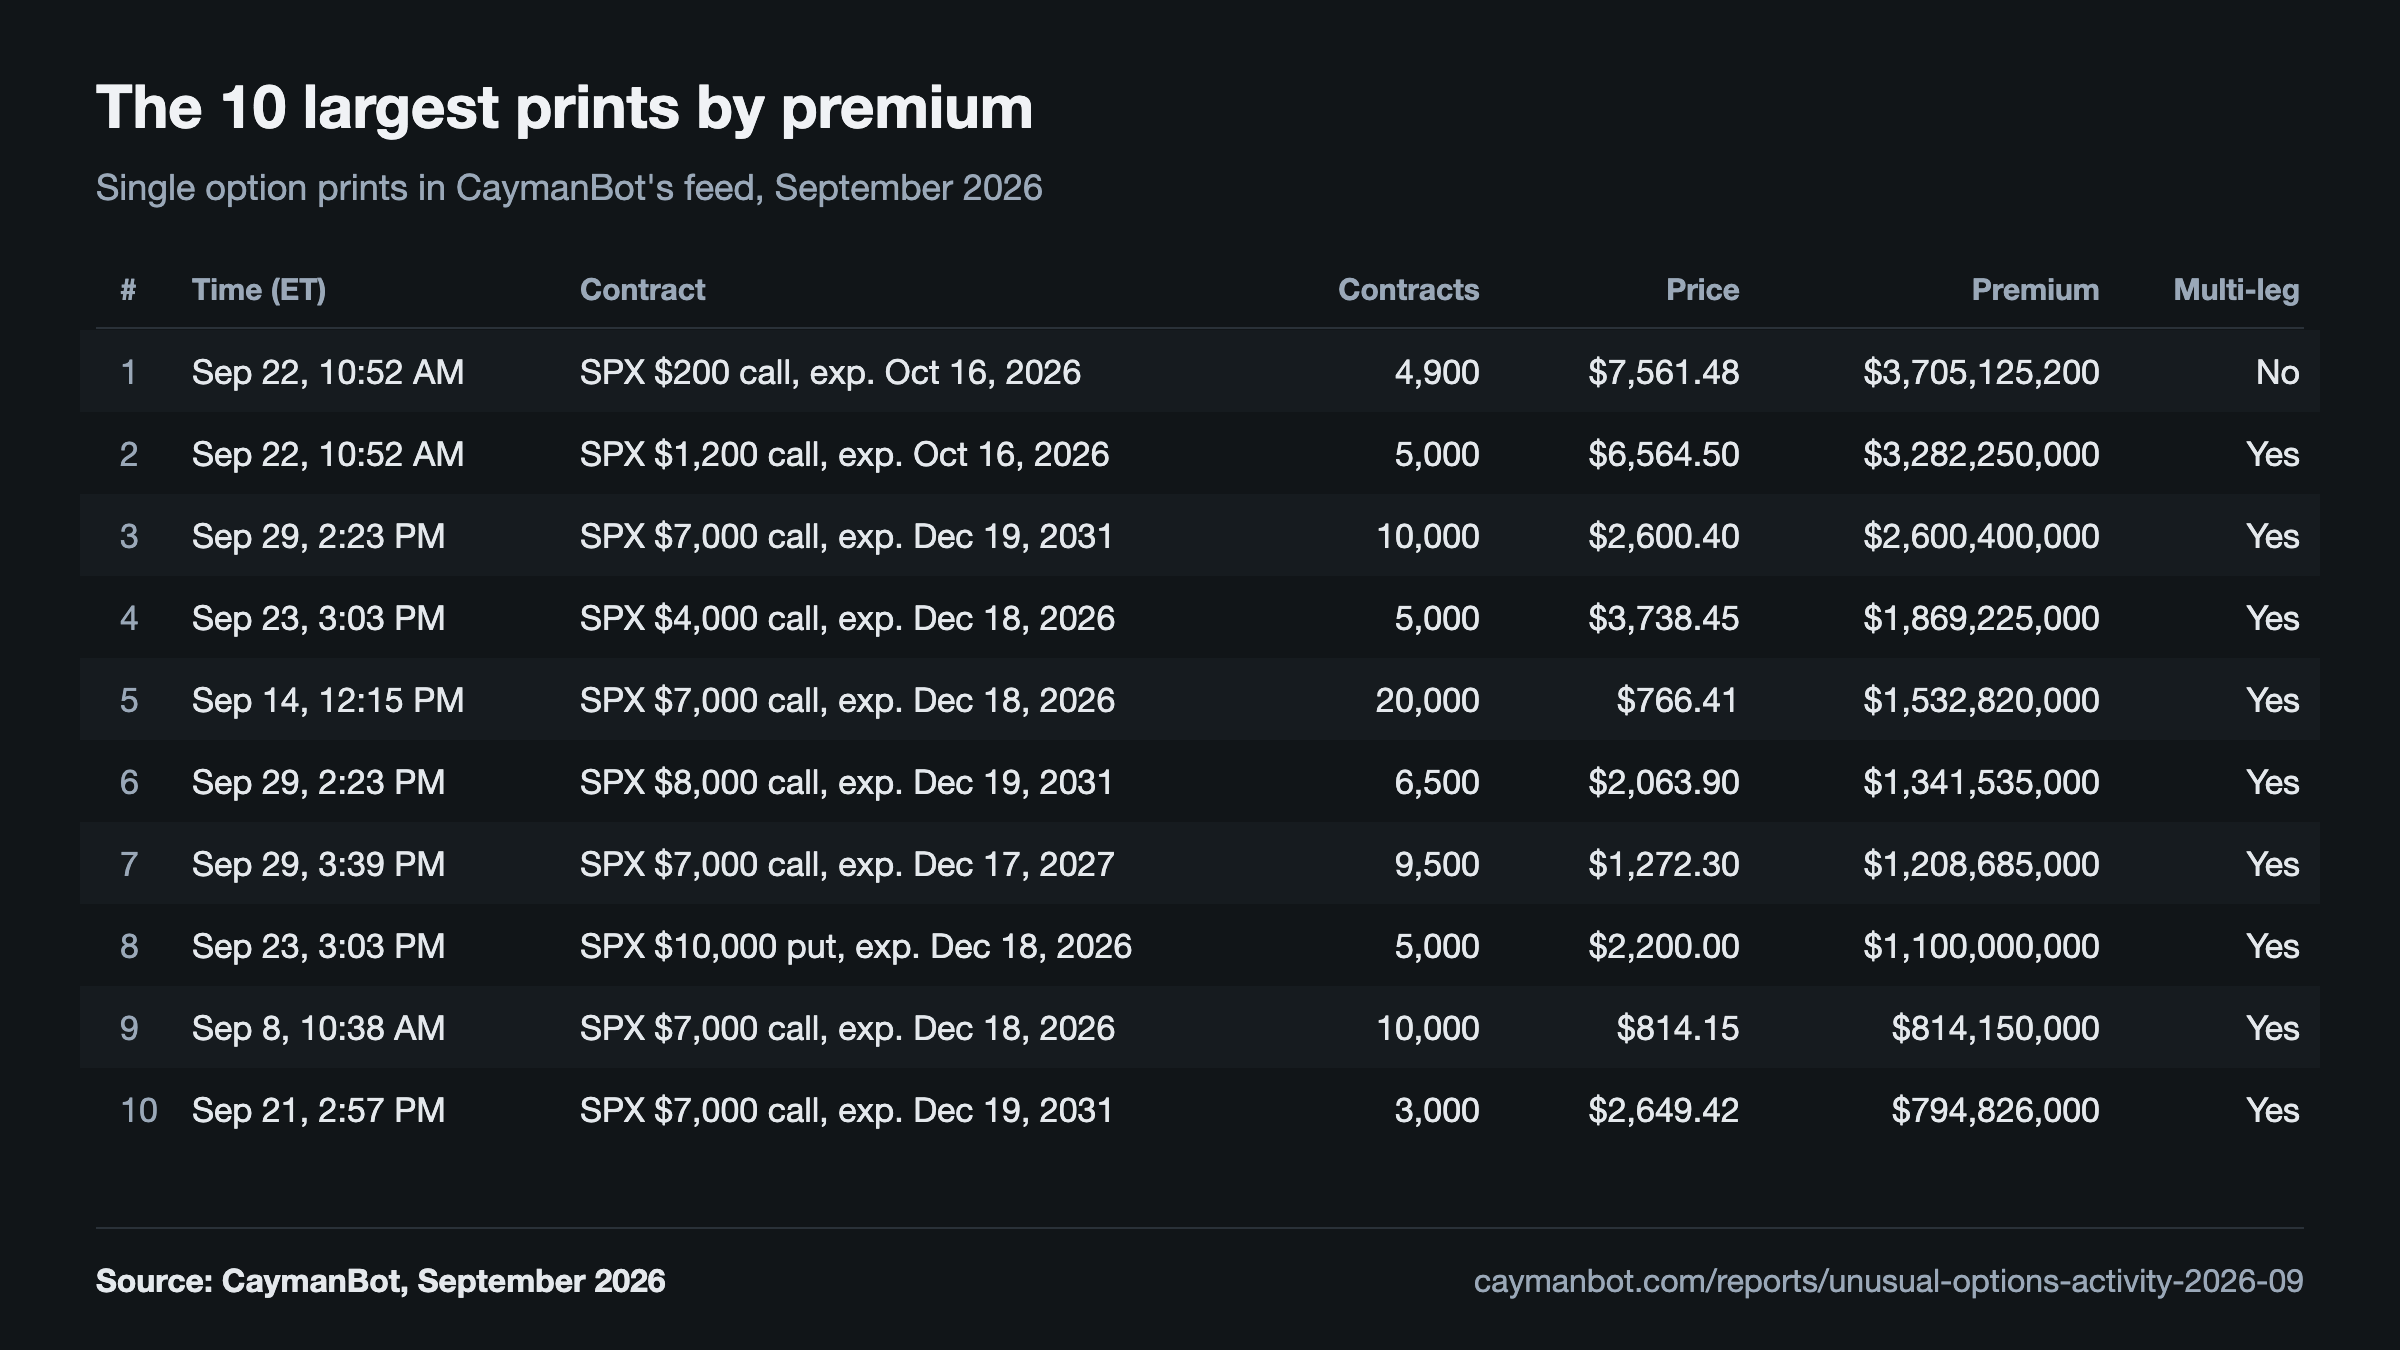
All 10 are SPX contracts, and 9 of them are marked in the feed as part of a multi-leg order. Premium is price times contracts times 100; a leg is one part of a larger order, so its premium alone does not show that order's net cost.
Show the data
| Rank | Time (ET) | Contract | Contracts | Price | Premium | Multi-leg |
|---|---|---|---|---|---|---|
| 1 | Sep 22, 10:52 AM | SPX $200 call, exp. Oct 16, 2026 | 4,900 | $7,561.48 | $3,705,125,200 | No |
| 2 | Sep 22, 10:52 AM | SPX $1,200 call, exp. Oct 16, 2026 | 5,000 | $6,564.50 | $3,282,250,000 | Yes |
| 3 | Sep 29, 2:23 PM | SPX $7,000 call, exp. Dec 19, 2031 | 10,000 | $2,600.40 | $2,600,400,000 | Yes |
| 4 | Sep 23, 3:03 PM | SPX $4,000 call, exp. Dec 18, 2026 | 5,000 | $3,738.45 | $1,869,225,000 | Yes |
| 5 | Sep 14, 12:15 PM | SPX $7,000 call, exp. Dec 18, 2026 | 20,000 | $766.41 | $1,532,820,000 | Yes |
| 6 | Sep 29, 2:23 PM | SPX $8,000 call, exp. Dec 19, 2031 | 6,500 | $2,063.90 | $1,341,535,000 | Yes |
| 7 | Sep 29, 3:39 PM | SPX $7,000 call, exp. Dec 17, 2027 | 9,500 | $1,272.30 | $1,208,685,000 | Yes |
| 8 | Sep 23, 3:03 PM | SPX $10,000 put, exp. Dec 18, 2026 | 5,000 | $2,200.00 | $1,100,000,000 | Yes |
| 9 | Sep 8, 10:38 AM | SPX $7,000 call, exp. Dec 18, 2026 | 10,000 | $814.15 | $814,150,000 | Yes |
| 10 | Sep 21, 2:57 PM | SPX $7,000 call, exp. Dec 19, 2031 | 3,000 | $2,649.42 | $794,826,000 | Yes |
Methodology
Source. Every figure on this page is an aggregate of the option trades in CaymanBot's feed, recorded print by print. These are CaymanBot's own counts of what its feed received, not official OCC or exchange statistics, and a print the feed did not receive is not counted.
Period. Sessions dated Sep 1, 2026 to Sep 30, 2026, where a session is a calendar day in New York time: 21 sessions.
Premium. A print's premium is its price times its contracts times the 100-share multiplier. Session and ticker totals add up every print: opening and closing trades, hedges and each leg of a multi-leg order alike. They measure activity, not net positioning.
Unusual-activity score. The same 0 to 100 score that drives CaymanBot's unusual-activity alerts. A symbol needs at least 5 prints and $100,000 of premium in the session to score at all. Its baseline is its average daily prints and premium over the 20 calendar days before the session, used once it has at least 3 days of data. Up to 30 points come from prints against that baseline (10 times log2 of the multiple), up to 30 from premium against it, and up to 20 from the session's premium (4 times log10 of premium over $1,000). A score of 70 or more is a flag.
Flags on this page. Every symbol was scored on each completed session's totals, 93,812 symbol-sessions in all. The product scores during the session, publishes at most 10 symbols per scan and holds a symbol back for 30 minutes after an alert, so its own list is shorter: in September 2026 it published 206 symbol-level flags for 188 symbols. Rerunning this page's score on the inputs stored with each of those 206 alerts reproduced every stored score within 0.01 points.
Largest prints. The query behind the free whale trades page, run on each session: the 10 largest prints by premium of every session, then the 10 largest of those.
Delay. OPRA options data delayed at least 48 hours (2 days). The aggregates were extracted on Oct 7, 2026.
Limits. A flag or a large print describes what traded. It does not say who traded, why, or what happens next. Labels such as unusual are classifications of observable prints, not facts about intent.
Data and citation. The aggregates behind every chart are published as JSON, and each chart has a PNG download. Cite as: CaymanBot, Unusual options activity report: September 2026, https://caymanbot.com/reports/unusual-options-activity-2026-09
See the trades behind the totals
CaymanBot shows each option print with its contract, premium and execution side, with filters, alerts and backtests.
Start freeData notes
OPRA options data delayed at least 48 hours (2 days).
CaymanBot, LLC receives consolidated options market data as a licensed OPRA vendor. Real-time options data is delivered to Premium subscribers who have completed the OPRA non-professional attestation; Free-plan data is delayed and conspicuously labeled as delayed.
Market data is for informational purposes only. Trading involves substantial risk of loss. Educational only, not financial advice.