What is gamma exposure (GEX), and how do traders use it?
Gamma exposure (GEX) estimates how much options dealers may need to hedge as a stock moves. How it is computed, what positive and negative gamma regimes mean, call walls and the flip level, and how retail, options and institutional traders use it, worked through SPY and AMZN.
Gamma exposure (GEX) is an estimate of how much options dealers may need to buy or sell a stock or index as its price moves. It is built from each option's gamma and open interest and summed by strike, so it shows where hedging may cluster and whether that hedging is more likely to damp moves or amplify them. Traders use it as context: a volatility filter, a map of reference levels, and a guide to how the picture may change around expiration. It is a model of positioning built on assumptions, and it says nothing reliable about direction.
How to read a GEX chart in 30 seconds
A GEX chart lists strikes, each with a bar. Seven terms cover it:
- Bars. There is one bar per strike. Its length shows how much dealer hedging, the stock dealers must buy or sell to stay neutral as the price moves, is tied to options at that strike.
- Green, or positive. Dealers are long gamma there, so their hedging tends to lean against price moves, which tends to calm them.
- Purple, or negative. Dealers are short gamma there, so their hedging tends to follow price moves, which tends to make them bigger.
- Spot. This is the spot price, where the stock trades now; CaymanBot tags the strike nearest to it.
- Flip level. Also called the gamma flip, this is the price where the running total of all the bars, added up from the lowest strike, crosses zero; above it the map leans calming, below it the map leans amplifying.
- Regime badge. It shows the GEX regime: Positive when the price is at or above the flip level, Negative when it is below.
- Pin zone and walls. The pin zone is the single biggest positive strike and walls are the other large ones; near an expiration the price can be drawn toward them.
The worked example at the end reads real SPY and AMZN charts from 3:45 pm ET on Friday 2026-10-09, the session's last snapshot.
What GEX measures
Options dealers (market makers) quote prices all day and end up holding whatever customers do not. To keep their risk small they delta hedge that book, usually by trading the underlying or its futures. Gamma is how fast an option's delta changes as the underlying moves, so it tells you how much a dealer has to re-hedge after a move. GEX adds that up across every contract.
How it is computed
The method most public GEX figures descend from is SqueezeMetrics' 2017 white paper. For calls at one strike it is gamma × open interest × 100 shares per contract; for puts the same with a minus sign. The total is the sum across every strike and every expiration.1 To express it in dollars per 1% move, the share figure is multiplied by the price and by 1% of the price, which is the same as gamma × open interest × 100 × price² × 0.01. CaymanBot computes it this way, with calls positive and puts negative.2
The four assumptions
The white paper is explicit that the number rests on four assumptions:1
- Every traded option has a delta-hedging dealer on one side.
- Investors sell calls and dealers buy them, so dealers are long call gamma.
- Investors buy puts and dealers sell them, so dealers are short put gamma.
- Dealers hedge exactly to the option's delta.
The second and third assumptions carry most of the weight. They reflect common behaviour: investors write calls against stock for income and buy puts for protection. When a strike is dominated by customers buying calls instead, its sign in the model is wrong.
The unit: per 1% move
GEX is usually quoted in dollars per 1% move in the underlying. Some tools show the per-100% figure instead, which is 100 times larger. Neither is wrong, but you cannot compare them directly, so check the unit first.
Positive and negative gamma: the hedging mechanics
The reason anyone watches GEX is the hedging loop.
A worked hedging example
The white paper uses a single call to show it.1 Take a call with a delta of 50 and a gamma of 10, both in shares per contract. If the underlying rises 1 point, the delta becomes 60; if it falls 1 point, it becomes 40. Either way the dealer has to trade 10 shares to stay neutral.
- Dealer long the call (long gamma). After the rise the dealer is longer than they want, so they sell 10 shares. After the fall they buy 10 shares. Their hedging sells strength and buys weakness.
- Dealer short a put (short gamma). The paper's example has a dealer short a 20-delta put, hedged by shorting about 20 shares. If the price falls and the put's delta rises to 50, the dealer must short 30 more shares, selling into the decline. If the price rises and the delta falls toward zero, they buy the shares back, buying into the rally.
Why one damps and the other amplifies
Scale that up to a whole market. When dealers are net long gamma, their hedging leans against moves: it adds supply into rallies and demand into dips. When they are net short gamma, their hedging follows the move. The white paper puts it simply: positive GEX implies hedging that buys lows and sells highs, and negative GEX implies the opposite.1
The research supports a real effect. Ni, Pearson, Poteshman and White (2021) find that market maker hedge rebalancing affects stock return volatility and the probability of large moves.3 Baltussen, Da, Lammers and Martens (2021) show that hedging short gamma means trading in the direction of price moves, which creates intraday momentum.4 Cboe's own research is more sceptical about one slice of this: it estimates that net market maker hedging of same-day (0DTE) S&P 500 options is small, no more than about 0.2% of daily liquidity.5 Both can be true. The effect depends on how large the dealer gamma is relative to normal trading.
The flip level, walls and pinning
The flip level
The flip level, also called zero gamma, is the price where aggregate GEX crosses zero.6 CaymanBot finds it by adding up net GEX strike by strike from the lowest strike upward and marking where that running total crosses zero, interpolating between the two strikes on either side.2 With no flip on the map, the badge falls back to the sign of the total.
Call walls and put walls
A call wall is the strike with the largest concentration of call gamma, and a put wall is its counterpart on the put side.7 On a net GEX map like CaymanBot's, the tallest positive bars play the call-wall role and the deepest negative bars play the put-wall role. Traders treat them as reference levels because hedging activity can be heaviest there.
Pinning into expiration
Near expiration, gamma concentrates in strikes close to the price, and a large position at one strike can pull the price toward it. Avellaneda and Lipkin (2003) model this: with unusually large open interest, delta hedging can push a stock toward the strike.8 Golez and Jackwerth (2012) find that S&P 500 futures are pulled toward the at-the-money strike on expiration days, a shift of at least $115 million in notional value per expiration day.9 Monthly options expire on the third Friday, and the next one is 2026-10-16. When that open interest expires, its gamma leaves the map, so walls can shrink and the flip can move.
How traders use GEX
None of the uses below treats GEX as a forecast of direction. They use it to estimate how the market may move, and where.
Retail and day traders
- A volatility filter. In a positive regime, dealer hedging leans against moves, so some traders are quicker to fade a move toward a wall. In a negative regime, they are slower to fade and more willing to let a move run, because hedging may add to it.
- Reference levels. The flip and the largest walls give intraday levels to watch: where the regime changes, and where hedging may thicken.
- Expiration days. Around the monthly expiration and on same-day (0DTE) expirations, traders watch large strikes near the price for pinning. Same-day options have become a large share of index trading: Cboe reported 0DTE at a record 66.2% of S&P 500 options volume in July 2026.10
Options traders
- Selling or buying premium. A positive regime is associated with quieter trading, which is the environment premium sellers prefer. A negative regime is associated with larger moves, which is where long options and long volatility can do better. The regime is one input next to implied volatility, not a substitute for it.
- Structuring around walls. Some traders place short strikes beyond a large wall, or set spread widths with the walls in mind, on the reasoning that hedging may resist a move through that level. It may not, which is why defined-risk structures are the usual choice.
Institutional desks
- Dealers themselves. For a market maker, gamma is a risk to manage. A short-gamma book loses on large moves in either direction, so desks track it to size their hedges and their quotes.
- The sell side publishes it. Wall Street banks publish daily estimates of dealer option positioning, and the theme reached mainstream financial coverage in 2020.11 These notes are one reason GEX levels get discussed so widely.
- Volatility and systematic funds. Funds that trade realized versus implied volatility watch the gamma regime as one input to how much the index may move. Volatility-control funds are linked to it indirectly: they buy equities when markets are calm and sell when they become turbulent, so a short-gamma stretch that lifts realized volatility can feed their selling.12
- Vanna and charm into expiration. Two second-order effects matter here. Vanna is how delta changes when implied volatility changes. Charm is how delta changes as time passes,13 so near expiration dealer hedges drift even if the price does not move. Both are why the hedging picture can shift in the last days before a large expiration, and why it can loosen after one.
Where GEX breaks
- The dealer side is assumed. Open interest says how many contracts are open, not who holds them. The call-long, put-short assumption is a convention.1
- Open interest updates once a day. Open interest counts contracts still open at the end of a session, so an intraday map uses the morning's figures, and a same-day option opened and expired within one session never appears in it.
- Large strikes can be one trade. A wall can be a single large spread or hedge, not broad positioning.
- Units and scope differ. Per-1% vs per-100%, and which expirations a tool includes, change the number a lot.
- It is not a direction call. Negative gamma says moves may be larger, not which way they will go.
Worked example: SPY and AMZN at 3:45 pm ET on 2026-10-09
All figures are per 1% move, from CaymanBot's GEX view as of 3:45 pm ET on Friday, the session's last snapshot.14
Here is the SPY chart; read it with the 30-second key above.
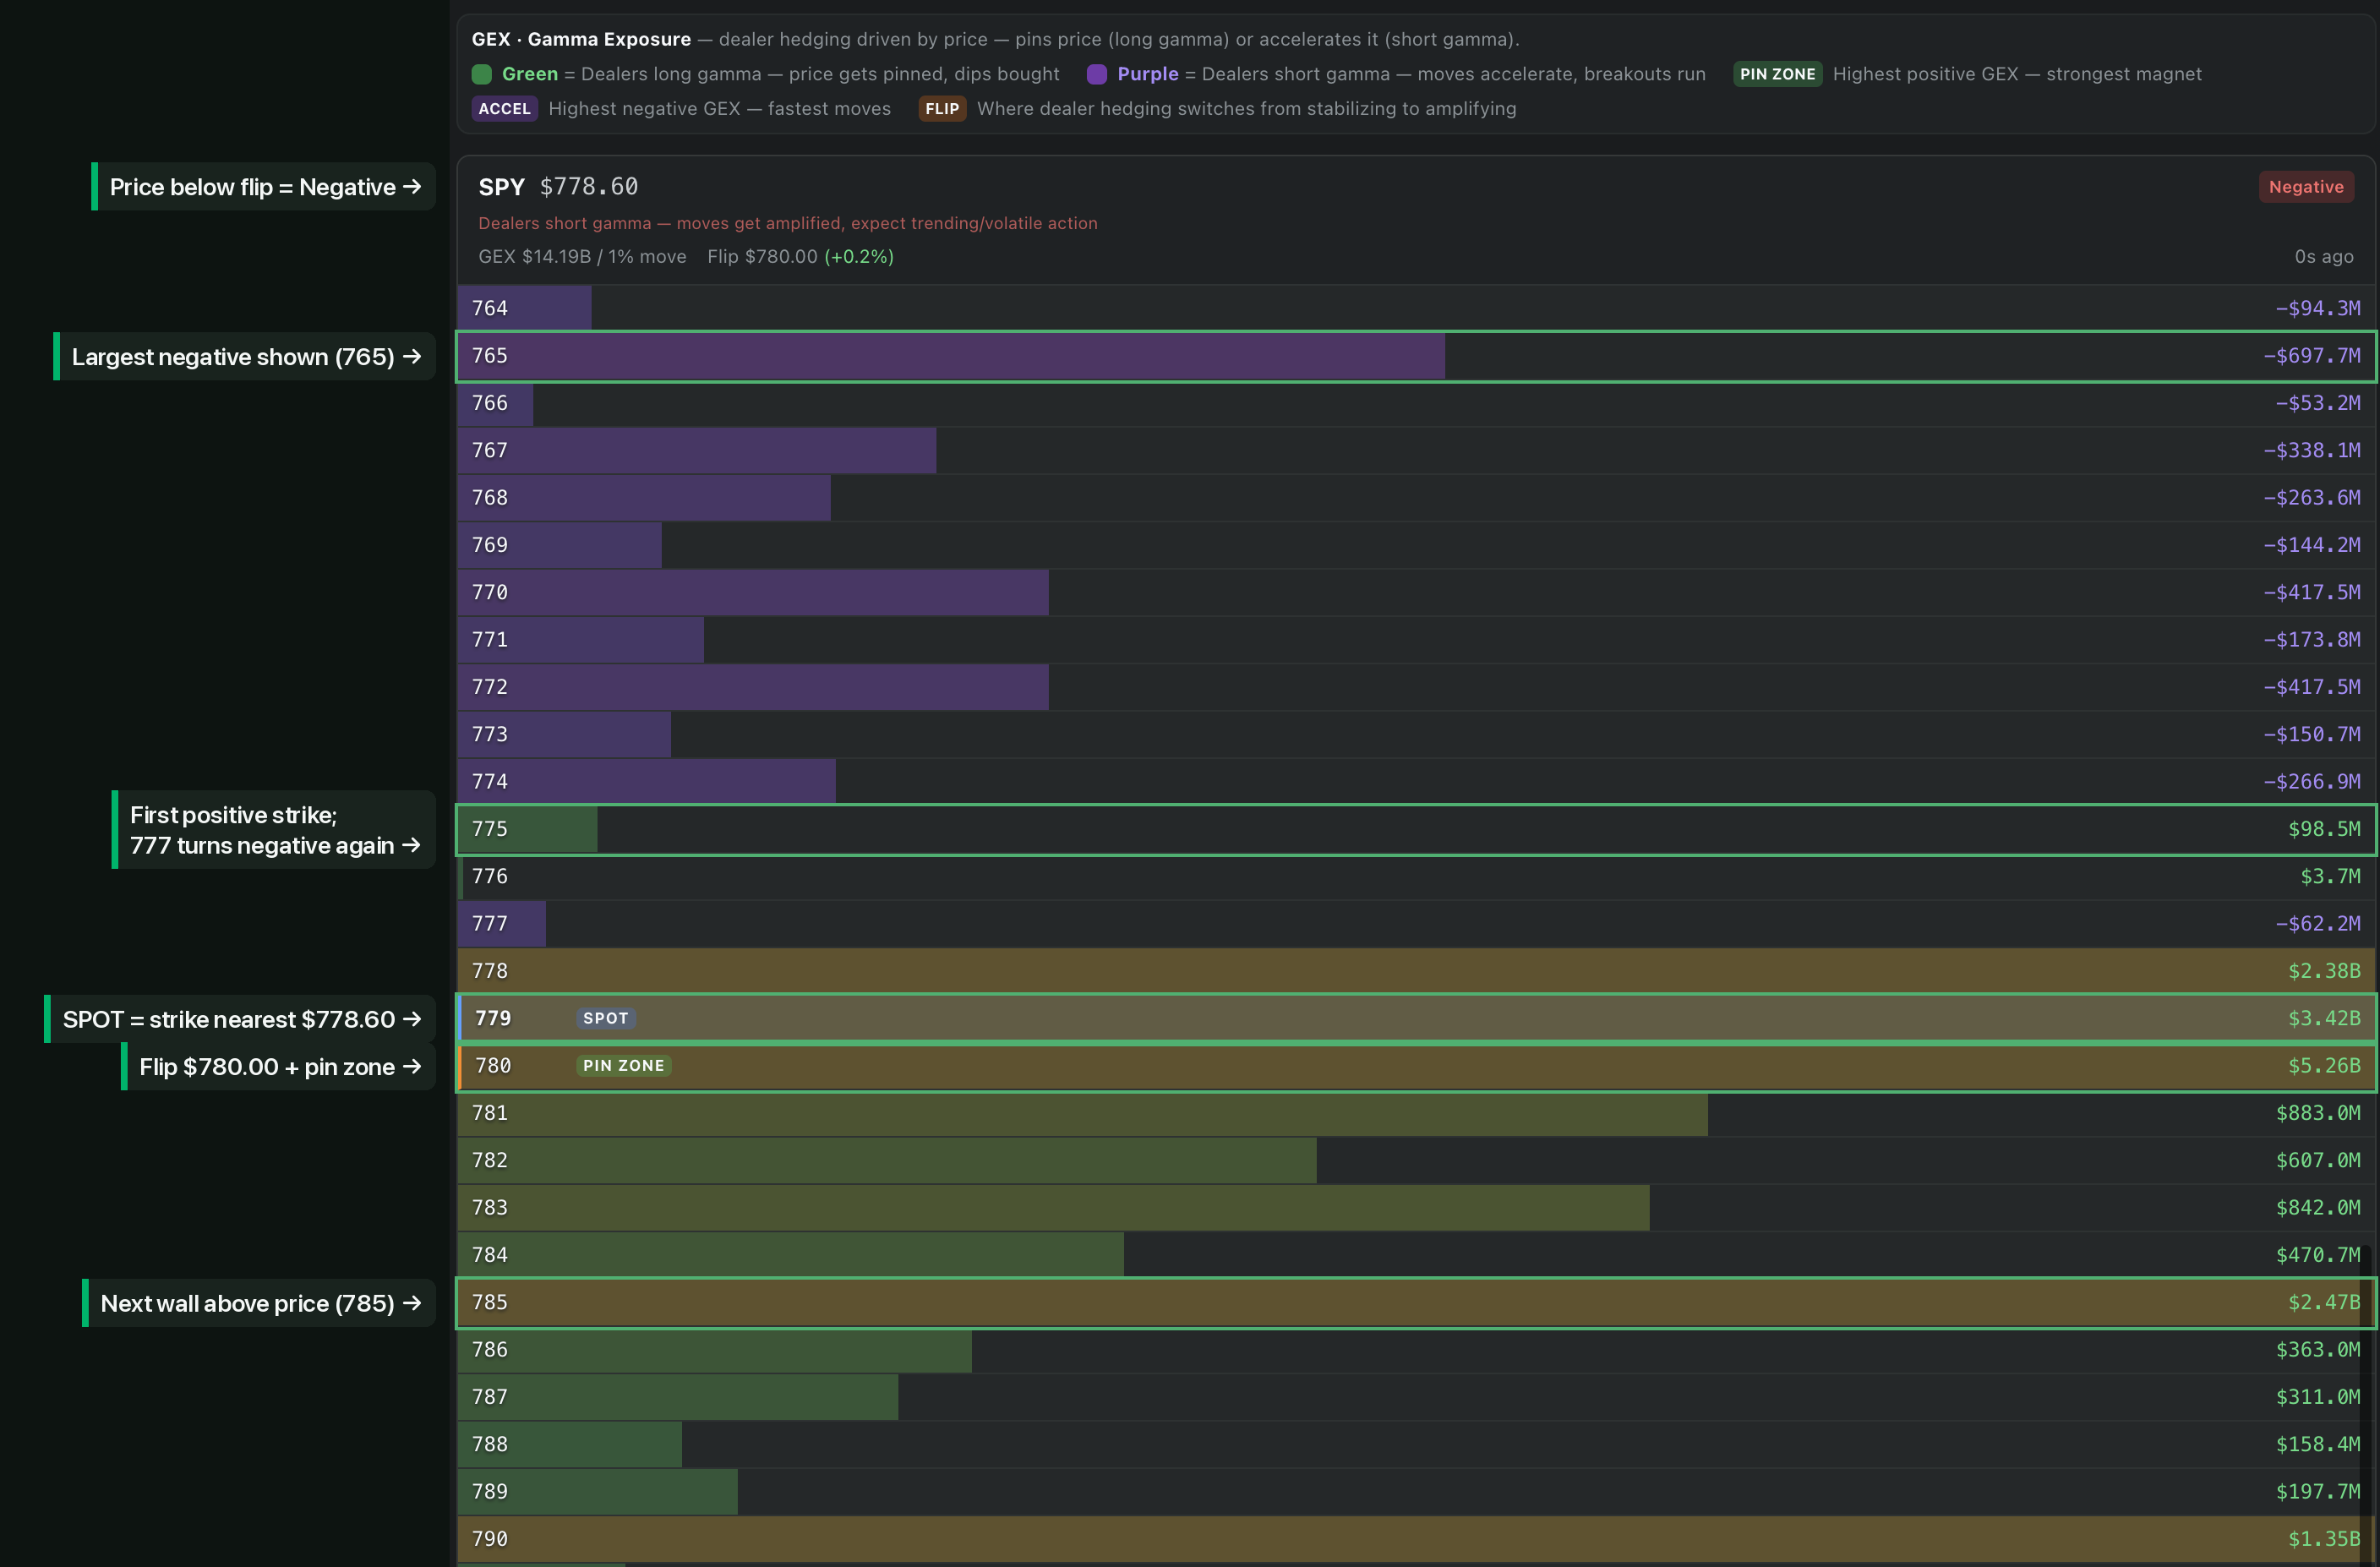
SPY GEX as of 3:45 pm ET Fri Oct 9, the session's last snapshot (CaymanBot app). Annotations are ours; click the image for full size.14
| Item | SPY | AMZN |
|---|---|---|
| Price (reference) | $778.60 | $262.51 |
| Flip level | $780.00, about 0.2% above | $260.00, about 1.0% below |
| Regime | Negative | Positive |
| Total GEX, per 1% move | about $14.19B | about $1.34B |
| Largest positive strike ("pin zone") | 780: about $5.26B | 262.5: about $553M |
SPY. Every strike on the ladder up to 774 is negative (765 at about -$698M, the largest negative in the figure; 770 and 772 at about -$418M each; 774 at about -$267M). 775 is the first positive strike ($98M) and 776 is barely positive (about $4M), but 777 turns negative again (-$62M), so one strike changing sign is not the flip. The large positive strikes cluster at 778 ($2.38B), 779 ($3.42B) and the pin zone at 780 ($5.26B). The app tags 779 as SPOT because it is the strike nearest the price of $778.60. Above that cluster, the next distinct wall is 785 ($2.47B), then 790 ($1.35B). The running total crosses zero at $780.00, just above the price, so the badge reads Negative even though the total is positive: the positive total comes from the 778 to 780 cluster and the strikes above it, while every strike below 775 is short gamma.
Dividing by SPY's price ($778.60) turns the 780 strike's $5.26B per 1% move into about 6.76 million shares of hedging per 1% move, if the dealer-side assumptions hold. The total is about 18.2 million shares.
AMZN shows the opposite case. Its flip sits at $260.00, about 1.0% below the price of $262.51, so the badge reads Positive. The pin zone is the 262.5 strike, right at the price, with about $553M, flanked by 260 ($187M) and 265 ($197M). Below the flip most strikes are small negatives (240 at about -$20M, 250 at about -$14M), though 255 is a small positive ($41M): the flip is where the running total crosses zero, and one small positive strike below it does not lift the total above zero on its own. Every strike shown above the price is positive.
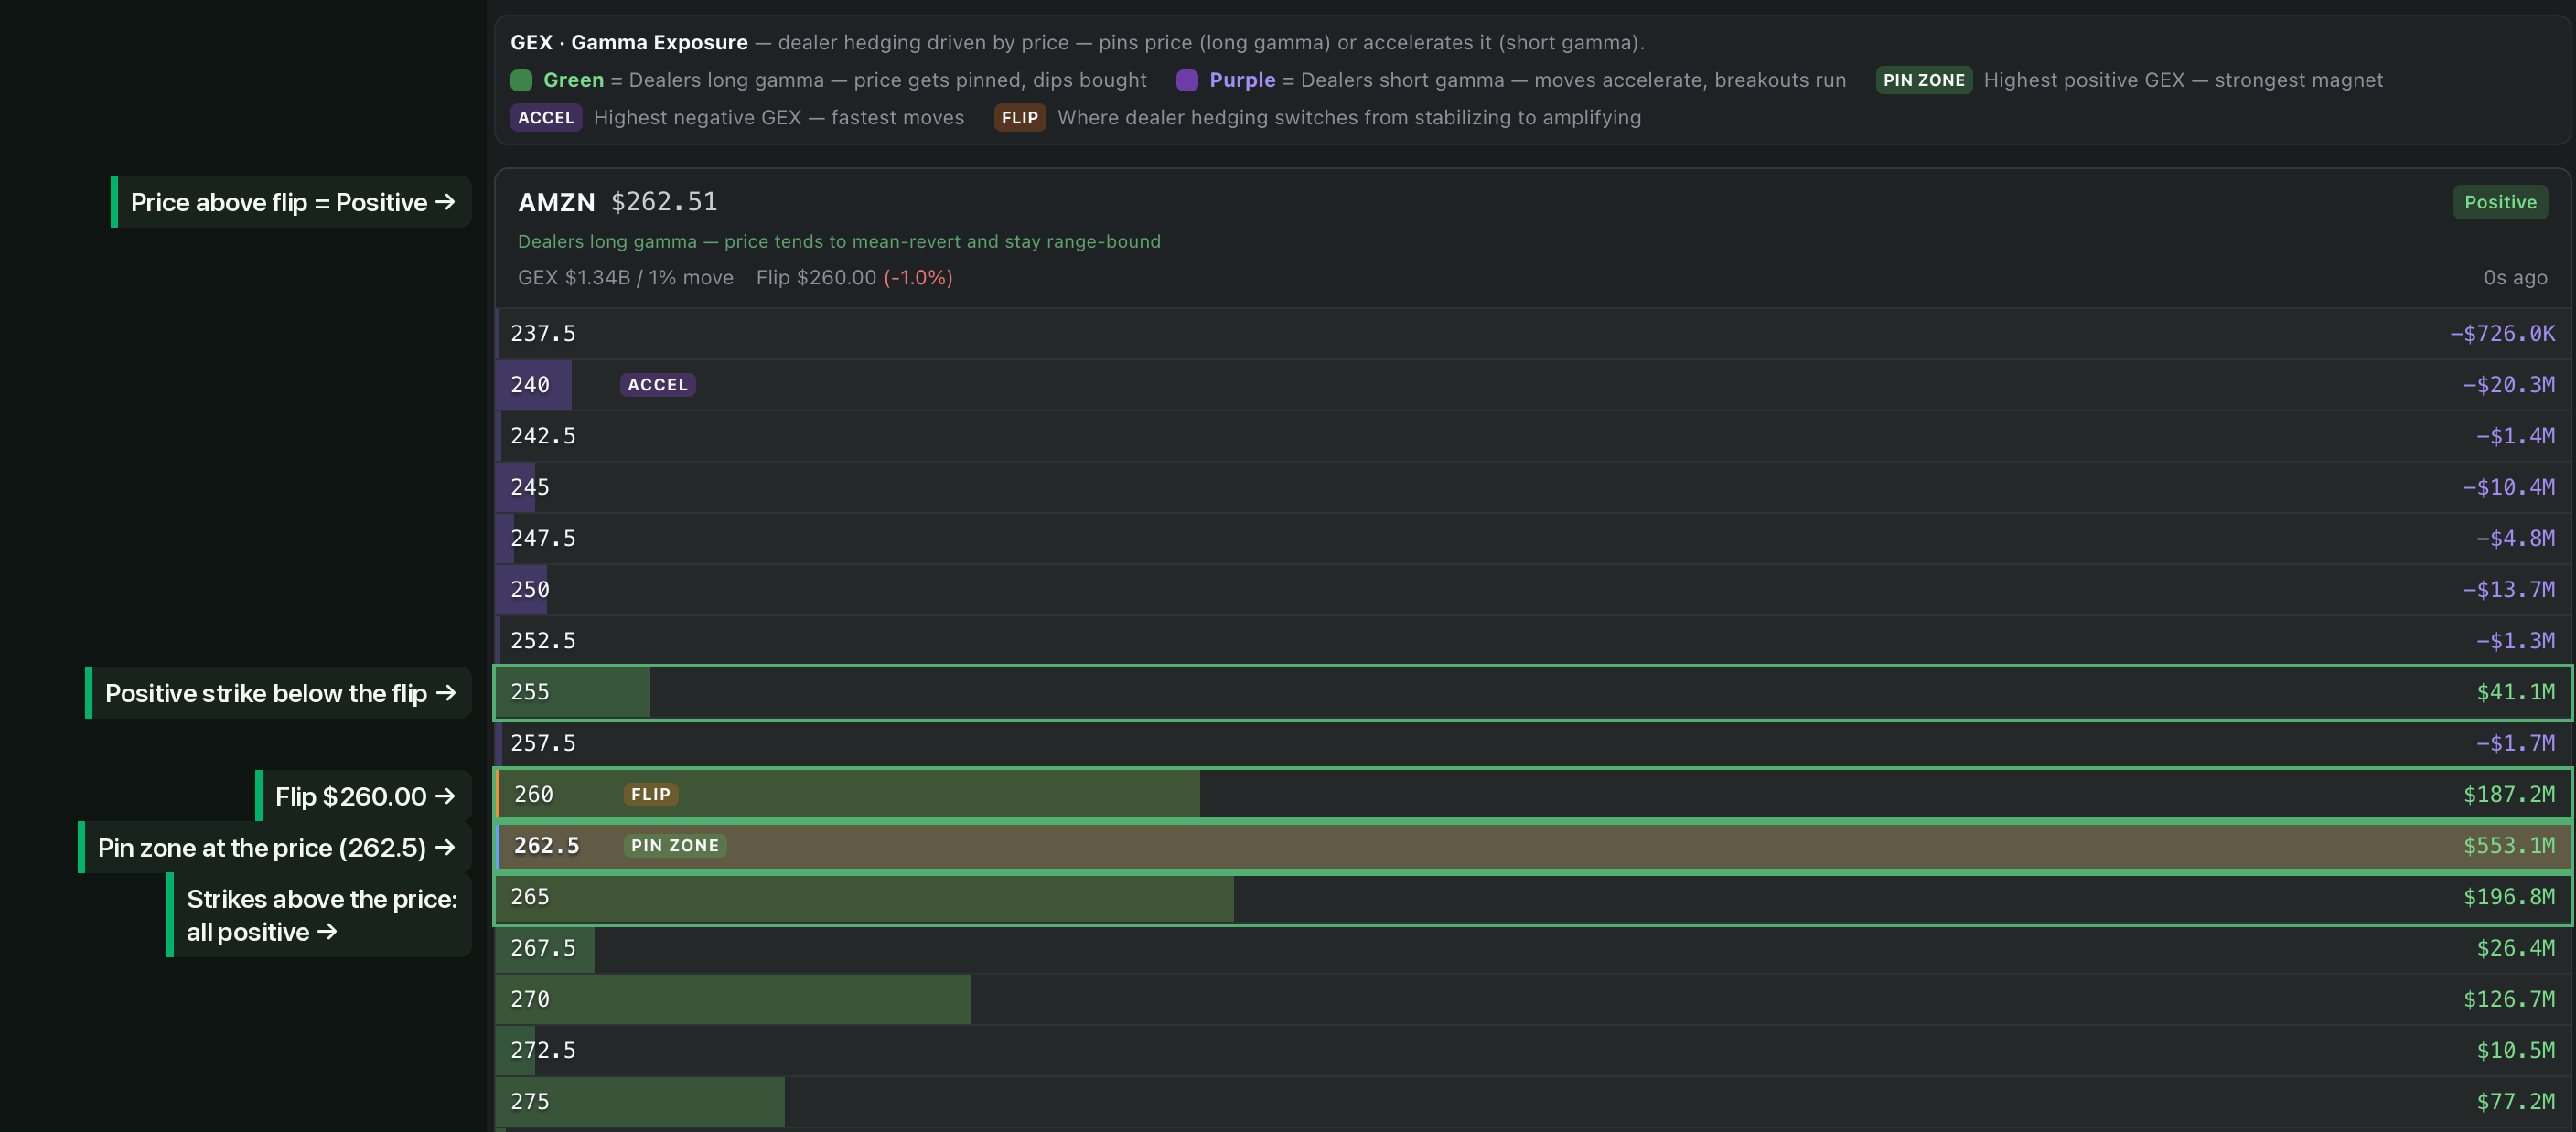
AMZN GEX as of 3:45 pm ET Fri Oct 9, the session's last snapshot (CaymanBot app). Annotations are ours; click the image for full size.
In the same snapshot, SPY, QQQ, IWM and SPX all read Negative going into the 2026-10-16 expiration (QQQ's flip sat at $769.64, about 2.5% above its price of $750.76), while AMZN, MSFT and TSLA read Positive.
How to practise reading it
Watch the same pages across a few sessions, especially around an expiration, and note when the regime and the flip change. See the gamma exposure glossary entry, the GEX heatmap and our guide to the gamma flip level. The free plan includes the public GEX pages, such as the SPY page. That page shows a once-a-day snapshot delayed at least 48 hours, so its figures differ from the logged-in app view shown above. New accounts start with a 14-day Premium trial.
Educational only, not investment advice.
Notes
-
SqueezeMetrics, "Gamma Exposure (GEX)", March 2016, revised December 2017: the GEX formula, the four assumptions and the hedging examples (the put example on p. 4, the call example on p. 5). https://squeezemetrics.com/download/white_paper.pdf ↩︎ ↩︎ ↩︎ ↩︎ ↩︎
-
CaymanBot GEX method: per contract gamma × open interest × 100 × price² × 0.01 (per 1% move), calls positive and puts negative, summed per strike; the flip is the zero-crossing of the cumulative net GEX from the lowest strike; the regime is the price relative to the flip. ↩︎ ↩︎
-
Ni, Pearson, Poteshman and White, "Does Option Trading Have a Pervasive Impact on Underlying Stock Prices?", Review of Financial Studies, 2021. https://scholars.hkbu.edu.hk/en/publications/does-option-trading-have-a-pervasive-impact-on-underlying-stock-p/ ↩︎
-
Baltussen, Da, Lammers and Martens, "Hedging demand and market intraday momentum", Journal of Financial Economics, 2021. https://pure.eur.nl/en/publications/hedging-demand-and-market-intraday-momentum/ ↩︎
-
Cboe (Mandy Xu), "0DTEs Decoded", 2025-05-02. https://www.cboe.com/insights/posts/0-dt-es-decoded-positioning-trends-and-market-impact ↩︎
-
SpotGamma, "Gamma Exposure (GEX)" explainer, updated 2026-08-18. https://spotgamma.com/gamma-exposure-explained/ ↩︎
-
SpotGamma, call wall and put wall explainer. https://spotgamma.com/call-wall-put-wall-explained/ ↩︎
-
Avellaneda and Lipkin, "A Market-Induced Mechanism for Stock Pinning", 2003. https://math.nyu.edu/~avellane/stock_pinning.html ↩︎
-
Golez and Jackwerth, "Pinning in the S&P 500 futures", Journal of Financial Economics, 2012. https://ideas.repec.org/a/eee/jfinec/v106y2012i3p566-585.html ↩︎
-
Cboe Global Markets, monthly trading volume release for July 2026, published 2026-08-05. https://ir.cboe.com/news/news-details/2026/Cboe-Global-Markets-Reports-Trading-Volume-for-July-2026/default.aspx ↩︎
-
Bloomberg, "Wall Street Dealers in Hedging Frenzy Get Blamed for Volatility", 2020-11-25, as reposted by SpotGamma. https://spotgamma.com/wall-street-dealers-in-hedging-frenzy-get-blamed-for-volatility/ ↩︎
-
Reuters, on volatility-control funds' equity exposure, 2026-10-01, as carried by Kitco. https://www.kitco.com/news/off-the-wire/2026-10-01/volatility-control-funds-near-record-equity-exposure-raising-selloff ↩︎
-
SpotGamma, on charm ("delta decay") and the end-of-day pin. https://spotgamma.com/?p=19721 ↩︎
-
CaymanBot app, GEX view: the session's last snapshot, 3:45 pm ET on 2026-10-09, captured 2026-10-10. Figures are per 1% move. ↩︎ ↩︎
Options data from OPRA, delayed at least 60 minutes.
Frequently asked questions
What is gamma exposure (GEX)?
Gamma exposure is an estimate of how much options dealers may need to buy or sell the underlying as its price moves, built from each contract's gamma and open interest and summed by strike. It is usually quoted in dollars per 1% move in the underlying.
What does negative gamma mean?
In the usual reading, negative gamma means dealers are short gamma, so their hedging trades go in the same direction as the move, which tends to amplify it. Positive gamma means their hedging leans against the move, which tends to damp it.
What is the gamma flip level?
The flip level, also called zero gamma, is the price where net gamma exposure changes sign. CaymanBot finds it where the cumulative net GEX, summed from the lowest strike upward, crosses zero.
What are call walls and put walls?
A call wall is the strike with the largest concentration of call gamma, and a put wall is the same on the put side. Traders watch them as reference levels because hedging activity can concentrate there, especially near expiration.
Does GEX predict which way the market will move?
No. GEX describes how dealer hedging may change the size of moves, not their direction. A negative reading says moves may be amplified in either direction.
Why are GEX numbers from different tools so different?
Tools differ in units (per 1% move or per 100% move, a factor of 100), in which expirations they include, and in how they assign the dealer side of each contract. Check the method before comparing two numbers.
Why does GEX matter around options expiration?
When large open interest expires, the gamma it carried leaves the map, so walls can shrink and the flip level can move right after the monthly expiration on the third Friday.