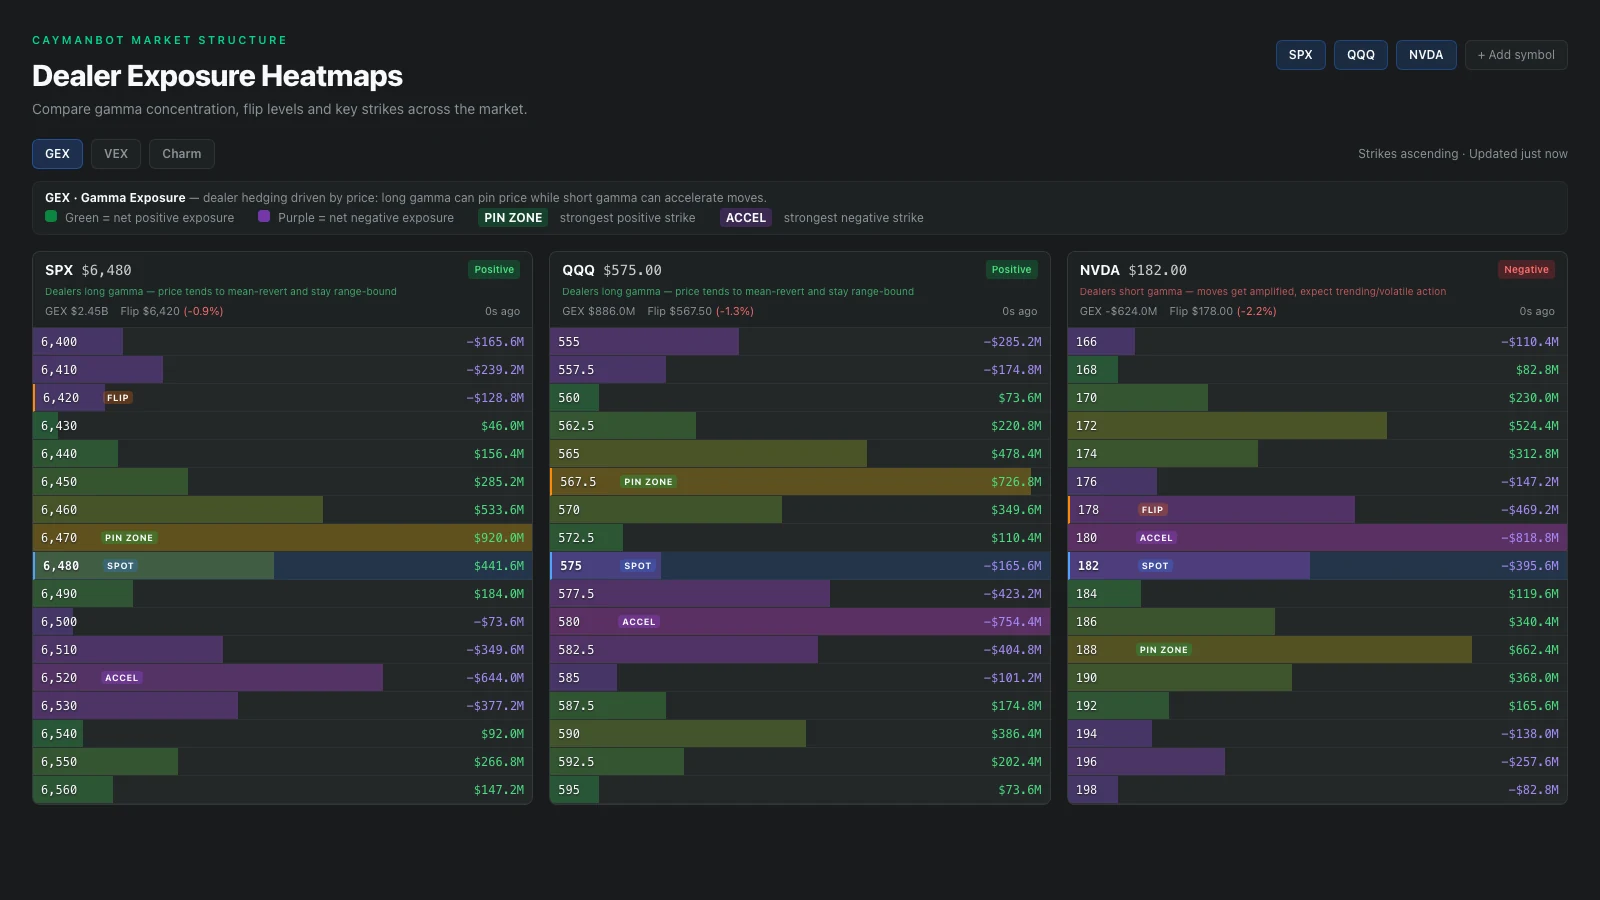
What is GEX?
Gamma exposure, commonly shortened to GEX, is an estimate of how option dealers’ delta exposure may change as the underlying price moves. Because dealers often hedge their inventories, changes in delta can create buying or selling pressure in the underlying. A GEX model aggregates contract-level estimates to show where that hedging sensitivity may be concentrated.
GEX is model-dependent. It relies on assumptions about dealer positioning and uses snapshots that change with price, time, volatility and open interest. It should be treated as a market-structure lens rather than a guaranteed forecast.
How to read a gamma exposure heatmap
A heatmap makes the distribution across strikes easier to compare. Large concentrations can become reference levels because dealer hedging activity may increase as spot approaches them. The gamma flip is an estimated price where the net profile changes sign, potentially marking a shift in how hedging flows interact with market movement.
- Start with spot price and the largest positive and negative strike concentrations.
- Compare the current price with the estimated gamma flip level.
- Watch how the profile changes across expirations and after large price moves.
- Combine GEX with price structure, volume, volatility and event risk.
- Avoid treating a modeled level as fixed support or resistance.
Use GEX with options flow
Options flow shows transactions; a GEX heatmap estimates the positioning landscape those transactions enter. Used together, they can answer different questions: where is activity appearing, and where might the existing options structure matter most? CaymanBot places heatmaps alongside flow, option chains, technical charts, alerts and backtesting to keep those questions connected.
Premium members can access GEX, VEX and Charm heatmaps. Coverage and freshness depend on available market data, and all values are for informational analysis only.
SPY, QQQ and NVDA GEX
The Heatmaps page in the CaymanBot app opens on SPY, SPX and QQQ and takes any optionable ticker you search for, up to six columns side by side, so NVDA GEX is one search away. Each column lists strikes colored by net gamma exposure and marks the spot price and the estimated gamma flip, and a single-symbol view puts GEX, VEX and Charm side by side. Heatmaps are part of Premium.
Without an account, the public SPY GEX, QQQ gamma exposure and NVDA GEX pages show a gamma exposure snapshot from a completed session: spot price, total GEX, the gamma flip, the regime and net GEX with open interest by strike. Those figures are delayed at least 48 hours.