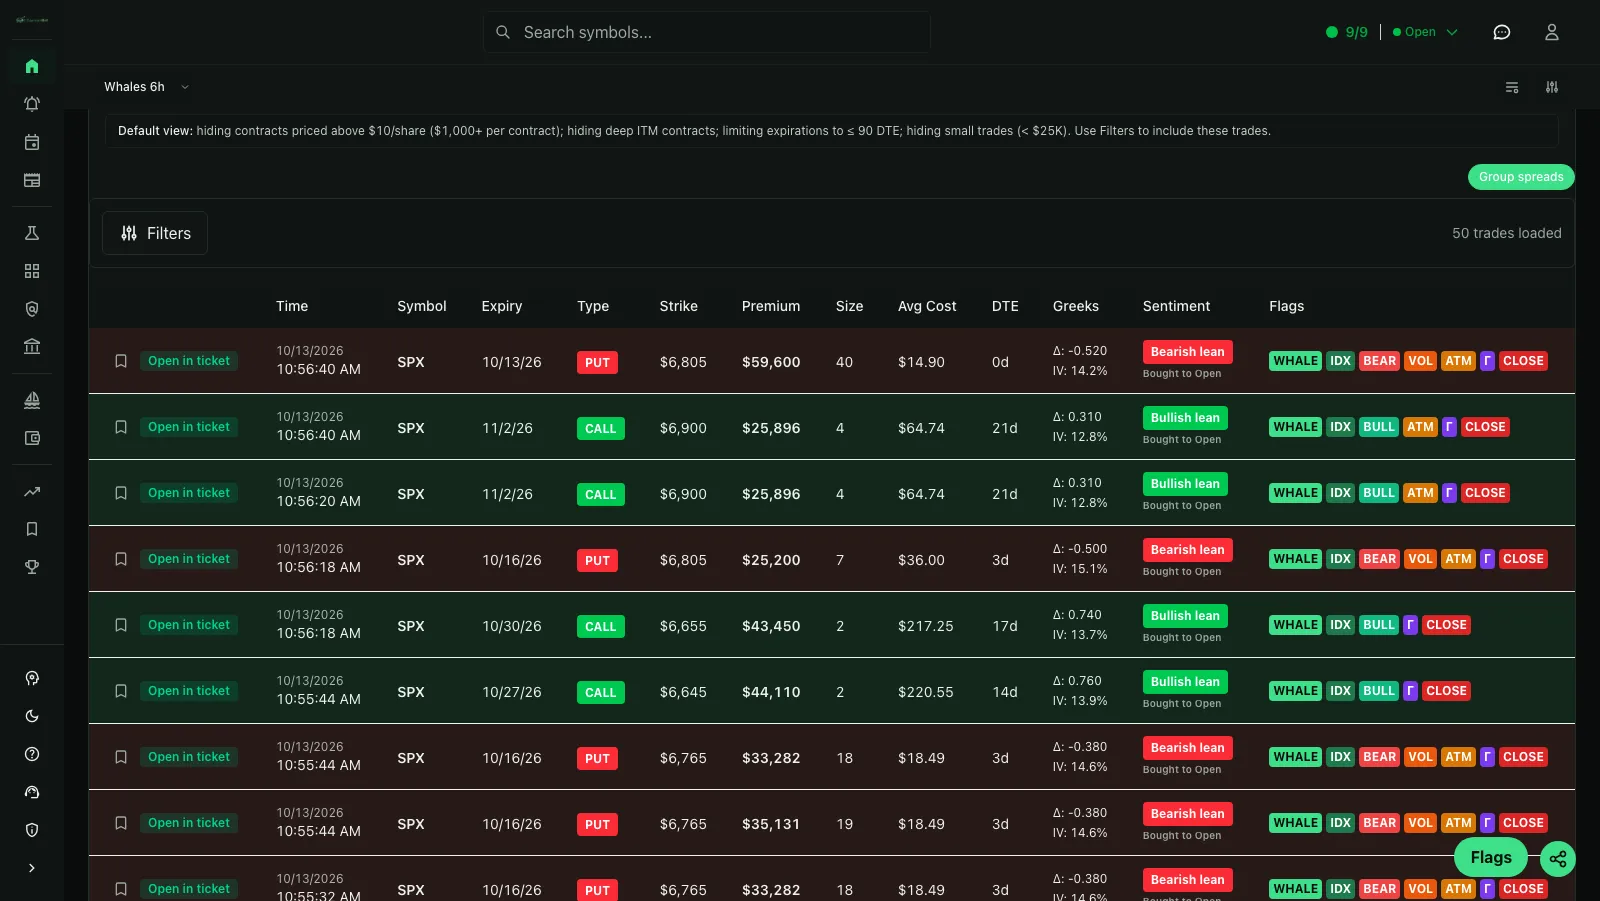
What counts as unusual options activity?
Unusual options activity is trading that stands out from the normal behavior of a contract or underlying symbol. Traders often look for exceptional volume, large dollar premium, repeated orders, short-dated contracts, activity far from the current stock price or aggressive execution near the ask or bid.
There is no universal threshold. A $100,000 trade may be extraordinary in a thin small-cap chain and routine in SPY. Good analysis compares the print with the instrument’s typical liquidity and considers whether the order may be opening, closing, hedging or part of a spread.
Signals used by an unusual options activity scanner
No single field makes a trade unusual. A scanner is most useful when it combines several observable characteristics and lets the user tune thresholds to the normal liquidity of each underlying. CaymanBot exposes those characteristics as searchable filters rather than collapsing every trade into one unexplained score.
- Compare current contract volume with prior open interest where available.
- Set minimum or maximum premium, order size, average cost, strike and DTE.
- Separate calls, puts, sweeps, multi-leg orders and selected trade directions.
- Check whether the trade executed near the bid, ask or midpoint.
- Look for several related prints across the same ticker and expiration.
- Review upcoming earnings, economic releases and company news.
Why unusual does not automatically mean institutional
Large premium and sweep-like urgency are sometimes marketed as smart-money or institutional options activity. Those descriptions can be shorthand for a print that deserves attention, but public options data does not identify the account or its motive. A market maker, fund, retail trader or linked multi-leg order can produce a similar visible print.
CaymanBot preserves uncertainty in the workflow. Direction, sentiment, whale and unusual-volume labels are classifications derived from trade and quote characteristics. Confirm the underlying trend, catalyst, liquidity, implied volatility and related legs before treating a classification as directional evidence.
From alert to evidence
CaymanBot connects unusual activity with options flow, whale alerts, technical charts, company news, earnings, option chains, heatmaps and a strategy lab. That connected workflow helps prevent a common mistake: seeing a dramatic premium number and acting before checking the contract or the catalyst.
You can use configurable alerts to watch the symbols and trade characteristics relevant to your own process. Alerts are informational and should be evaluated against your risk tolerance and independent research.
Primary sources
Definitions, source details and material claims were checked against these primary references.