What the put/call ratio measures
The put/call volume ratio divides the number of put contracts traded by the number of call contracts traded in one session. For example, 1,200 put contracts and 800 call contracts give 1,200 ÷ 800 = 1.50. A value above 1.00 means more puts than calls traded, and a value below 1.00 means more calls than puts traded.
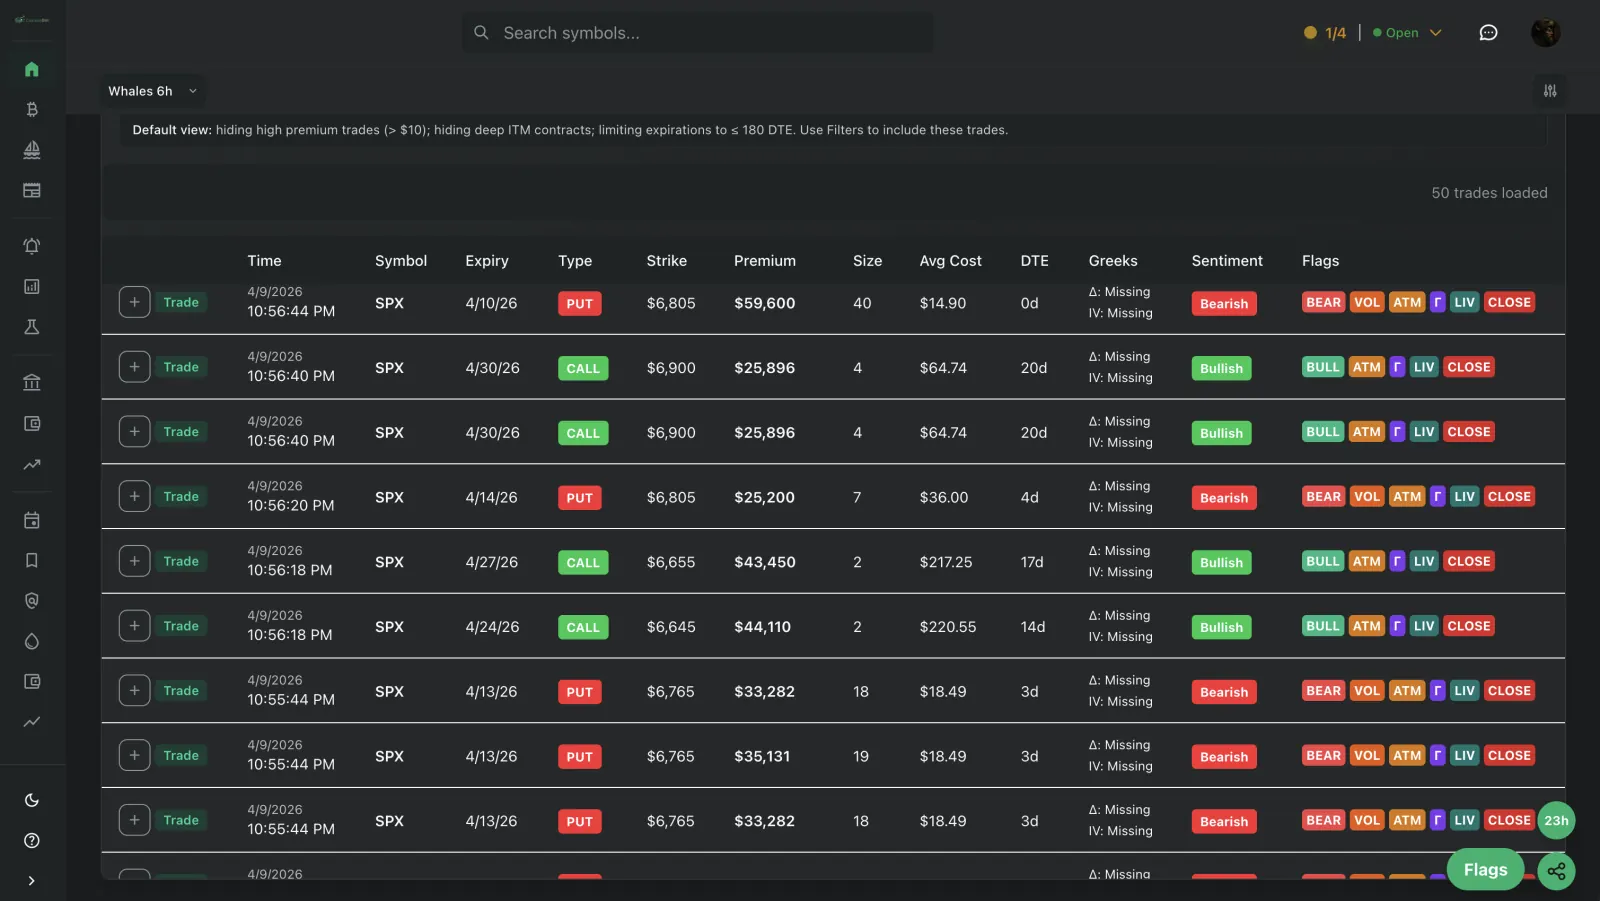
The table above is computed from the option trades in CaymanBot's feed for each ticker, across all strikes and expirations, for one completed session delayed at least 48 hours. It is not an official exchange or OCC volume total, so it can differ from ratios that exchanges or other data providers publish.
- Above 1.00: more put contracts than call contracts traded.
- Below 1.00: more call contracts than put contracts traded.
- 1.00: equal put and call volume.
- n/a: no call volume was recorded for the session, so the ratio is undefined.
How to read high and low readings
A high reading means put volume was large relative to call volume in that session. Traders use puts to hedge stock and portfolio exposure, to sell premium and to close earlier positions, so a high reading does not show that anyone expected a decline. A low reading means call volume outweighed put volume, which can come from call buying, call selling, covered call writing or closing trades.
Read the ratio as context, not as a forecast. Compare a ticker with its own recent readings and with other tickers, then look at which strikes and expirations traded before drawing any conclusion. Index ETFs such as SPY and QQQ are widely used for portfolio hedging, so their usual range can differ from a single stock's.
Volume ratio versus open-interest ratio
A volume ratio counts contracts traded during one session. An open-interest ratio divides put open interest by call open interest, which counts contracts still open after the prior clearing cycle. The volume ratio reflects one session of trading, while the open-interest ratio changes only as positions are opened or closed, so the two can move in different directions.
Each ticker page, such as SPY or QQQ, shows both the put/call volume ratio and the put/call open-interest ratio. For the difference between the two measures, see options volume vs open interest. For strikes, premium and gamma exposure by ticker, see options volume by ticker.
Primary sources
Definitions, source details and material claims were checked against these primary references.