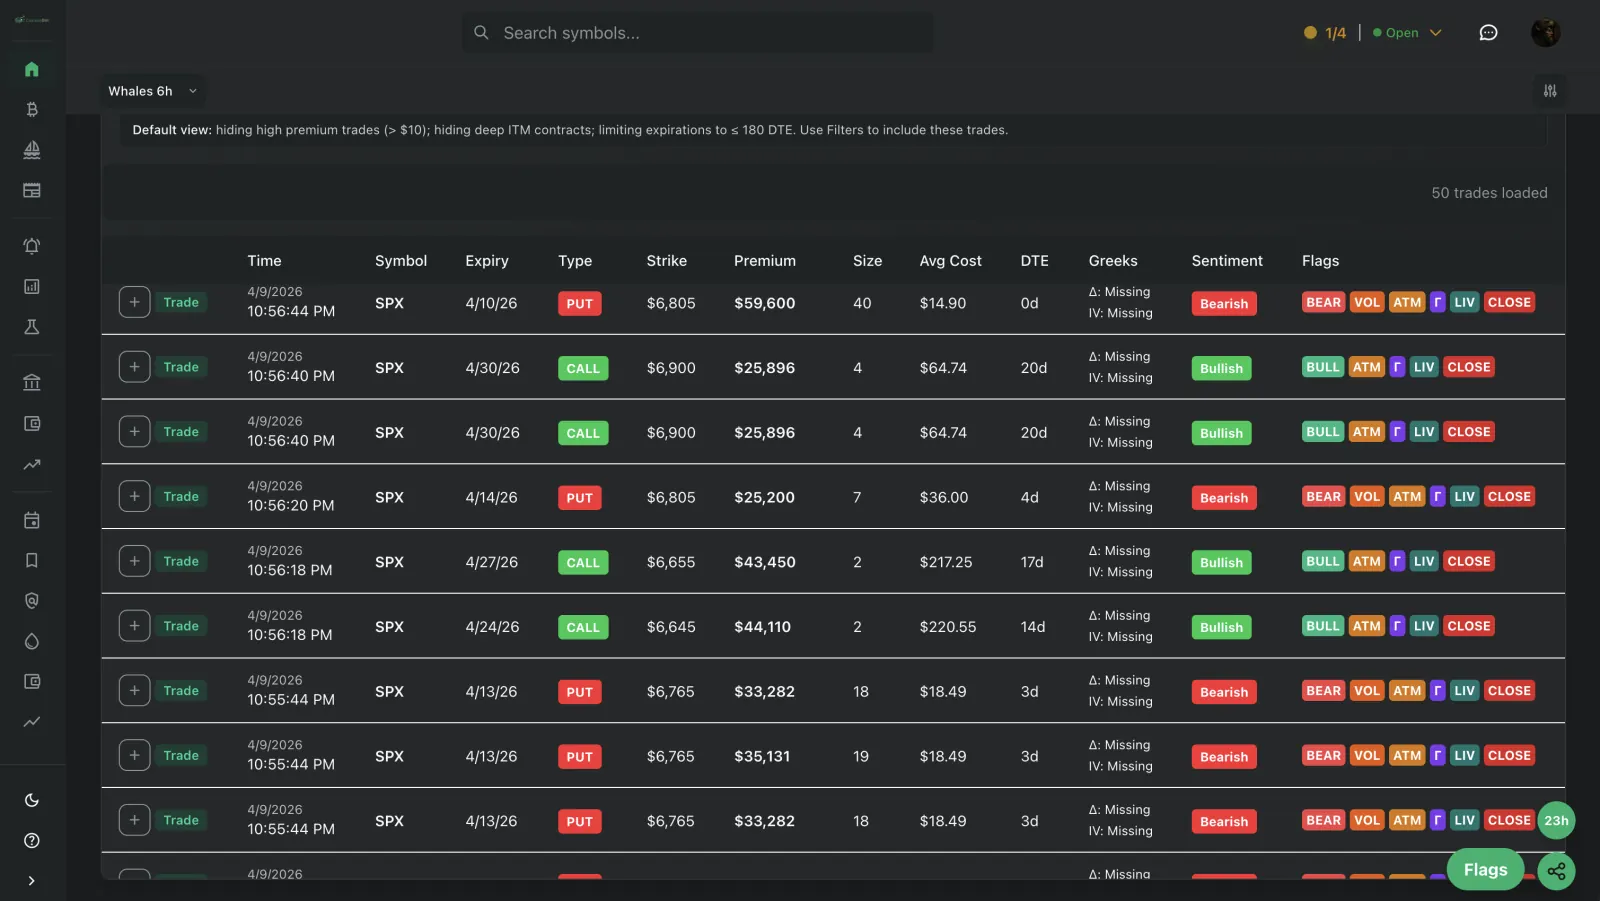
A real example: one AAPL put, field by field
Here is a past trade from the options tape, used only as an example. The contract has already expired. On September 9, 2026 at 15:58 ET, 193 contracts of the AAPL September 18, 2026 $317.50 put traded at $6.75, labeled bought to open (BTO). The quote was $6.60 bid and $6.85 ask. AAPL was at $315.55, so the put was already in the money, with 9 days left to expiry.
- Ticker and type: AAPL, put. A put gains value as the stock falls.
- Strike: $317.50. The price the put lets its owner sell AAPL shares at.
- Expiry: September 18, 2026. After that date the contract is gone.
- Size: 193 contracts. One contract covers 100 shares.
- Price: $6.75. The quote was $6.60 bid / $6.85 ask, so the midpoint was $6.725. This fill sits just above the middle, leaning only slightly toward the ask.
- Side: labeled bought to open (BTO). That’s the feed’s read of a buyer starting a new position. Whether a trade opens or closes a position is inferred, not printed on the trade.
- Premium: $6.75 × 100 × 193 = $130,275.
Bid, ask and what the fill price hints at
The ask is the lowest price sellers will take right now, and the bid is the highest price buyers will pay. A trade that fills at or near the ask usually means the buyer was the one in a hurry, paying up instead of waiting. A fill near the bid points the other way, to a seller. It is a strong hint, not proof. A fill near the middle, like this AAPL put at $6.75 against a $6.725 midpoint, tells you little about who was in a hurry.
Premium is the total cash that changed hands: the option price, times 100 shares per contract, times the number of contracts. That is how a $6.75 option becomes a six-figure trade.
Size vs open interest: is it unusual?
Open interest is the number of contracts already open before today’s trading. Volume is how many traded today. The volume vs open interest guide covers both in depth.
Before this print, the $317.50 put had 2,079 contracts open, and the day’s volume shown with this print was 1,119. 193 contracts is under 10% of what was already open (about 9%). That is real money, but it is not new positioning big enough to stand out. It is a modest trade, not unusual activity.
A BTO put is also not automatically a bet that AAPL falls. Someone who owns AAPL shares might buy puts as insurance. That is a hedge, and on the tape it looks the same.
So what does unusual mean? In plain terms: size that is large compared with the contract’s open interest and its normal daily volume, traded on the ask or the bid side, often in a contract with a short time to expiry. The classic tell is a single trade bigger than the open interest itself, because that many contracts cannot all be closing old positions. The unusual options activity page goes further.
The common mistake: a $1 million trade that is less than it looks
Another past example from the same expiry. On September 2, 2026 at 11:55 ET, 600 contracts of the AAPL September 18, 2026 $310 call traded at $17.15 against a $17.10 bid / $17.35 ask (midpoint $17.225), so near the bid, labeled sold to open (STO). Premium: $17.15 × 100 × 600 = $1,029,000.
A headline would call that a $1M call trade and a bullish sign. Look closer. The fill near the bid points to a seller, and selling a call is not a bet that the stock goes up. The $310 call also had 20,252 contracts open, so 600 is about 3% of that. Big premium does not mean bullish, and it does not mean unusual.
Common mistakes when reading options flow
Most flow mistakes come from reading one number and skipping the rest.
When you want the full checklist, the how to read options flow guide goes deeper on sweeps, spreads and multi-leg orders.
- Treating every big print as a directional bet. Many are hedges, one leg of a spread, or someone closing a position.
- Ignoring the side. Bought to open (BTO) and sold to open (STO) on the same contract mean opposite things.
- Chasing after the fact. By the time you see a print, the price it filled at is gone, and the move may be over.
- Reading one print instead of the pattern. Repeated trades in the same strike and expiry say more than one big trade.
- Skipping open interest. A size that looks big can be small next to what is already open.
Where CaymanBot fits
CaymanBot shows options trades with their strike, expiry, premium, size and side, next to volume and open interest. The Free plan shows options data delayed 60 minutes and never expires, and you get a $100K paper balance to practice with.
In the first two Learning Mode stages, each trade on the feed comes with a plain-English sentence you can check against the strike, expiry and premium.
Real-time options flow is on Premium, for users who complete the OPRA non-professional attestation. CaymanBot, LLC receives consolidated options market data as a licensed OPRA vendor. Real-time options data is delivered to Premium subscribers who have completed the OPRA non-professional attestation; Free-plan data is delayed and conspicuously labeled as delayed.
Start on the Free plan and read your first prints on delayed data.
Educational only, not financial advice. Market data is for informational purposes only. Trading involves substantial risk of loss.
Primary sources
Definitions, source details and material claims were checked against these primary references.